Curated OER
Make Line Graphs
In this graphing worksheet, 5th graders use 2 line graphs to answer 4 word questions. They use data from two charts to make a single and a double line graph.
Curated OER
Data Handling: Bar Chart Showing Frequency
In this bar graph worksheet, students analyze a bar graph showing soccer goals scored. Students then use the data to solve 7 problems.
Curated OER
Graphing Inequalities
In this graphing inequalities worksheet, students complete 8 inequality tables. Students then graph and shade the 8 inequalities on a coordinate plane.
Curated OER
Math for Fourth Grade: Statistical Charts
In this math for fourth grade statistical charts activity, 4th graders answer 7 multiple choice questions in standardized test format about data, charts and graphs.
Curated OER
Graphing Worksheet: Favorite Sports
In this graphing activity, students analyze a bar graph in which favorite sports are displayed. Students answer 8 questions about the graph. Note: The bars in the graph are shaded in different colors.
Curated OER
More with Graphing and Intercepts
In this math worksheet, students graph the equations through recognizing the position of the intercepts. They also create a function table for each.
Curated OER
Slope & Intercepts
In this slope and intercepts worksheet, 9th graders solve and graph 6 different problems that include responding to questions in reference to each equation. First, they complete the table and graph by solving each equation. Then,...
Curated OER
Probability
In this probability worksheet, 8th graders solve and complete 15 different problems related to determining the probability of various events. First, they complete the table illustrated on the sheet. Then, students use the table to...
Curated OER
Equations as Relations
In this equations as relations worksheet, 10th graders solve and graph 9 different problems that include determining various ordered pairs. First, they determine the ordered pairs that are solutions to each equation. Then, students solve...
Curated OER
Graphs involving Exponential Functions
In this algebra worksheet, students graph exponential functions and analyze it for growth and decay. There are 9 problems with an answer key.
Curated OER
Graphs
In this algebra worksheet, learners solve linear equations through graphing and quadratic equations through factoring. There are 4 questions dealing with systems of equations.
Curated OER
Skittle Math
In this skittle math worksheet, students sort skittles by color and create a bar graph for each color of skittle. Students also answer comparison, ratio, and relationship questions about the skittles.
Curated OER
Graphing Functions
In this graphing functions worksheet, students write functions in logarithmic and exponential forms. They evaluate logarithms and determine the inverse of a function. Students graph functions. This six-page worksheet...
Curated OER
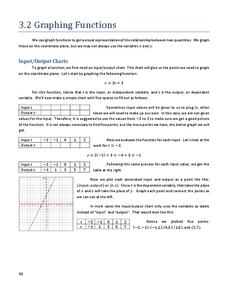
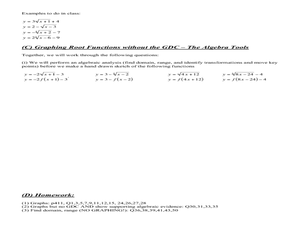
Graphing Radical Functions-A Graphic Introduction
In this Algebra II worksheet, 11th graders graph root functions and analyze the domain, range, intercepts, maximum and minimum values, and end behavior. students use that information to transform the graphs of root...
Virginia Department of Education
Factoring for Zeros
Relate factors to zeros and x-intercepts. Scholars first graph quadratics in both standard and factored forms to see that they are the same. They go on to use the graphs to see the relationship between factors and x-intercepts.
Mathed Up!
Scatter Graphs
Make an estimate by getting in line. The class works with scatter plots and lines of best fit to make an estimate for given values. Pupils determine whether there is a positive or negative correlation and draw a best-fit line. Using the...
Noyce Foundation
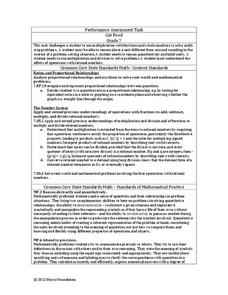
Cat Food
Determine the right mix of cans of cat food. The resource consists of an assessment task to determine the cost to feed two cats for a specific number of days and requires scholars to interpret remainders within a context....
Virginia Department of Education
How Much is that Tune?
Tune in for savings! Scholars investigate pricing schemes for two different online music download sites. After comparing the two, they determine the numbers of songs for which each site would be cheaper.
Curated OER
Hands On: Linear Equations
For this linear equation worksheet, 5th graders complete the equations, and fill in the function tables, before graphing the equation on the coordinate planes in 4 problems . They use equations with variables to solve 2 problems.
Curated OER
Table Readings
In this table worksheet, students read questions and interpret tables. Questions include information concerning unemployment, oil imports, and foreign students. This multiple-choice worksheet contains 10 problems. ...
Curated OER
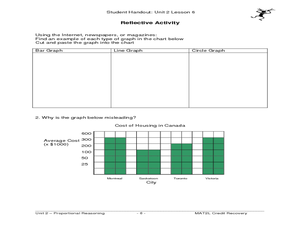
Introduction to Graphs: Bar Graphs, Line Graphs, Circle Graphs
In this graphing data worksheet, learners answer 5 short answer questions about graphs. Students determine which type of graph best represents various data sets.
Curated OER
Line graphs
In this line graphs instructional activity, students read 2 line graphs and answer short answer questions about them. Students answer 5 questions for each graph.
Curated OER
Making a Bar Graph
In this bar graph worksheet, students analyze a data table and bar graph depicting information about stickers collected. Students answer 5 questions about the data displayed.
Curated OER
The Circle Graph
In this circle graph worksheet, students complete problems involving many circle graphs including a compass rose, degrees, and more. Students complete 7 activities.


