McGraw Hill
Glencoe: Self Check Quizzes 1 Using Graphs to Make Predictions
Use Glencoe's randomly generated self-checking quiz to test your ability to use graphs to make predictions. Each question has a "Hint" link to help. Choose the correct answer for each problem. At the bottom of the page click the "Check...
PBS
Wnet: Thirteen: Math in Basketball: Lesson Plan
In this lesson plan, students will explore ways that mathematics are used in basketball. Students will explore the concept of a function and will learn to use function notation. Students will recognize, describe, and represent quadratic...
Better Lesson
Better Lesson: Graphing Using a Frequency Table
Multiple graphs can represent the same data set and make the information easier to understand.
Scholastic
Scholastic: Bars, Lines, and Pies
Students will learn and reinforce skills for creating, applying and analyzing pie charts, bar graphs and line graphs.
Alabama Learning Exchange
Alex: Ice Cream Sundae Survey
Learners quickly realize the importance of learning how to read and find information in charts, graphs, and tables compared to finding the same information written in a paragraph. This is a fun, high energy lesson!This lesson plan was...
Illustrative Mathematics
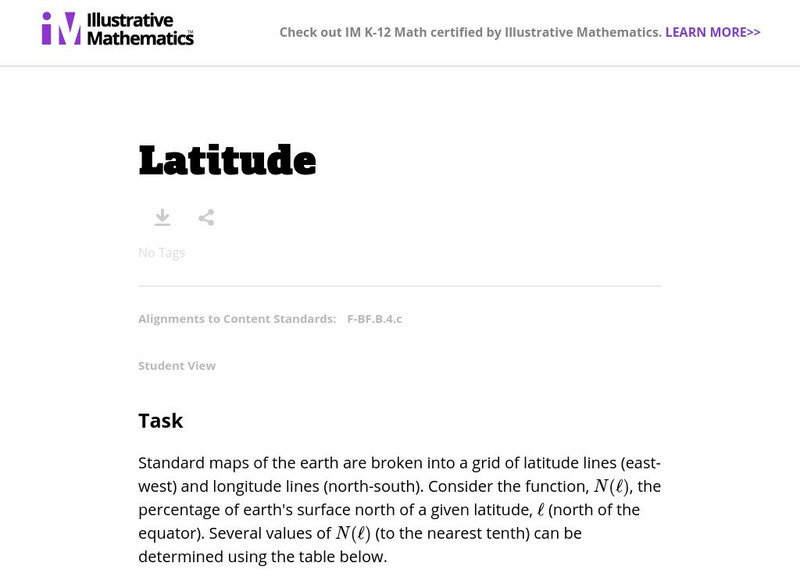
Illustrative Mathematics: F Bf Latitude
For this task, students are presented with data about latitude and the percentage of the Earth's surface north of each latitude line. They are to use this data to sketch a graph, analyze it, and build an understanding of an invertible...
Alabama Learning Exchange
Alex: Incline Plane and the Crashing Marble
Young scholars will measure the effects of the height of an inclined plane on the force a marble produces to move a plastic, foam, or paper cup across a table. Students will discover that the higher the incline plane, the more force...
University of Texas
Inside Mathematics: Our Pets [Pdf]
This task challenges a student to demonstrate understanding of concepts involved in representing and interpreting data.
PBS
Pbs: Beating Usain Bolt
Use mathematics to determine what is required to beat world champion Usain Bolt in a 200-meter race. This video focuses on systems of equations that are visualized by completing a table of values and looking for a point of intersection...
Other
Nearpod: Proportional Relationships
For this lesson, 7th graders will learn how to identify proportional relationships from tables, graphs, and equations. They will also learn how to identify the unit rate and write an equation to represent proportional relationships.


