Better Lesson
Better Lesson: Places Everyone. Analyzing and Creating Stem and Leaf Plots
The students will be using discovery techniques to learn about stem and leaf plots.
Annenberg Foundation
Annenberg Learner: Organizing Data in a Stem and Leaf Plot
A stem and leaf plot is a graphical representation for investigating variation. You will convert an ordered stem and leaf display grouped by tens into an ordered display grouped by fives.
National Council of Teachers of Mathematics
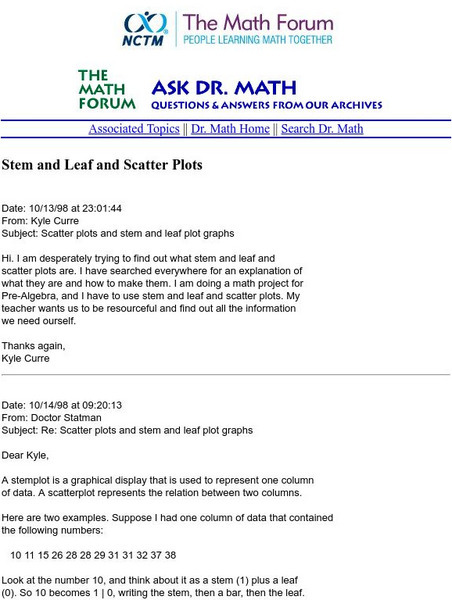
The Math Forum: Nctm: Ask Dr. Math: Stem and Leaf and Scatter Plots
This site is a question/response page which focuses on stem-and-leaf representation and how to construct scatter plots. Dr. Math works through an example and gives commentary notes. Site also contains links for more help.
Scholastic
Scholastic: Cultivating Data
Students will understand key concepts of data analysis and their graphic representations. Students will construct and interpret data tables, line plots, box-and-whisker plots and stem-and-leaf plots, scatterplots with line of best fit,...


