Curated OER
Statistics for Graphing
Students use the Internet to access a variety of websites that present statistics and information for use in graphing. They represent sports statistics, geographical measurements, temperatures and more.
Bowland
Fashionista
So trendy! Show your class how to identify trends in sales patterns using mathematics. Scholars use a software simulation to collect data on age groups, price, and sales at a fashion store. This data allows individuals to determine the...
EngageNY
Sampling Variability in the Sample Mean (part 1)
How accurate is data collected from a sample? Learners answer this question using a simulation to model data collected from a sample population. They analyze the data to understand the variability in the results.
Illustrative Mathematics
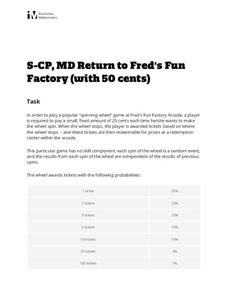
Return to Fred's Fun Factory (with 50 Cents)
The penny arcade gets the statistics treatment in this fun probability investigation. A non-standard game of chance is described and then the class is set loose to find missing probabilities, determine common outcomes, and evaluate...
Curated OER
Energy Conservation Lesson 1: Fossil Fuels and the Ticking Clock
Students explore energy production by participating in a class discussion. In this renewable energy instructional activity, students discuss the differences between solar, coal, wind and fossil fuel energy sources and why some are better...
Curated OER
Statistical Process Control
Young scholars brainstorm items they have that use memory and view Statistical Process Control PowerPoint presentation. They complete Statistical Process Control Simulation/experiment then find the average, range and standard deviation...
Illustrative Mathematics
Waiting Times
Probability prevails in this assignment as youngsters determine the probability of finding a blue pen in a cereal box when they can come in blue, green, yellow, or red. Learners set up a simulation to determine the outcome of compound...
American Statistical Association
More Confidence in Salaries in Petroleum Engineering
Making inferences isn't an exact science. Using data about salaries, learners investigate the accuracy of their inferences. Their analyses includes simulations and randomization tests as well as population means.
American Statistical Association
Chunk it!
Chunking information helps you remember that information longer. A hands-on activity tests this theory by having learners collect and analyze their own data. Following their conclusions, they conduct randomization simulations to...
Curated OER
Chances Are......You're Right
Young mathematicians study probability. In this math lesson plan, learners calculate odds, and convert those into percentages of probability. Fractions are also used, making this lesson plan quite rich in some of the more difficult...
Statistics Education Web
Did I Trap the Median?
One of the key questions in statistics is whether the results are good enough. Use an activity to help pupils understand the importance of sample size and the effect it has on variability. Groups collect their own sample data and compare...
EngageNY
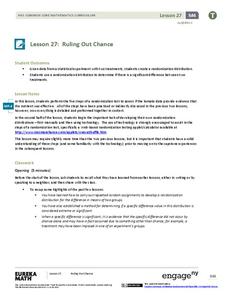
Ruling Out Chance (part 3)
Pupils analyze group data to identify significant differences. They use simulation to create their own random assignment data for comparison.
Kenan Fellows
Lego Thinking and Building
Run a simulated airplane manufacturing plant with your pupils as the builders! Learners build Lego airplane models and collect data on the rate of production, comparing the number produced to the number defective. Using linear...
Bowland
Crash Test
Use mathematics and simulations to investigate car crashes. IScholars test hypotheses involving car crashes. They collect, analyze, and display data from computer simulations to support or refute their hypotheses.
Curated OER
Probability and Expected Value
Students collect data and analyze it. In this statistics lesson, students make predictions using different outcomes of trials.
Curated OER
Designing Models to Simulate Actual Events Using a Random Number Generator
Students design models to simulate actual events using a random number generator on a calculator. They estimate the likelihood of a particular outcome using results of simulations. Answer Key included.
Curated OER
Capture/Recapture
Learners use proportions to estimate the size of populations. They describe the data with using a graph or table of the estimate. Students use descriptive statistics to calculate mean, median, and mode. They also compare and contrast an...
Curated OER
Using Random Sampling to Draw Inferences
Emerging statisticians develop the ability to make inferences from sample data while also working on proportional relationships in general. Here, young learners examine samples for bias, and then use random samples to make...
Curated OER
Something Fishy (Statistics)
Students are introduced to a problem involving an environmental issue. They are introduced to the capture-recapture method which involves capturing fish, tagging them, returning them and recapturing another sample. Pupils work in...
Curated OER
Walking on Air
Learners collect and analyze data with a graph. In this statistics lesson, students use central tendencies to find the meaning of their data. They display the data on a Ti calculator.
Curated OER
Gender Issues through Chi-square Experiments
Students investigate teachers and gender preference. In this statistic lesson, students collect data of teachers calling on students to see if they are calling on one gender more than the other. Students examine the data and draw...
American Statistical Association
Confidence in Salaries in Petroleum Engineering
Just how confident can we be with statistics calculated from a sample? Learners take this into account as they look at data from a sample of petroleum engineer salaries. They analyze the effect sample size has on a margin of error and...
Curated OER
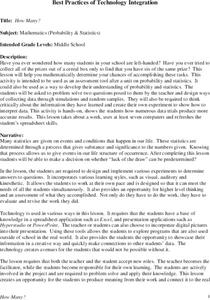
How Many?
Middle schoolers explore and design ways to collect data through simulations and random samples. They perform two experiments to determine the answers to various probability problems, and present the data/graphs in the form of a...
Statistics Education Web
When 95% Accurate Isn’t
Investigate the effect of false positives on probability calculation with an activity that asks scholars to collect simulated data generated by a calculator. To finish, participants analyze the probability of certain outcomes which lead...


