EngageNY
Sampling Variability in the Sample Mean (part 2)
Reduce variability for more accurate statistics. Through simulation, learners examine sample data and calculate a sample mean. They understand that increasing the number of samples creates results that are more representative of the...
Curated OER
Get the Picture!
Astronomers practice downloading data from a high-energy satellite and translate the data into colored or shaded pixels. As a hands-on activity, they use pennies to simulate high-energy satellite data and they convert their penny...
Google
The Law of Large Numbers and Probability
Learners investigate why theoretical probability doesn't always match reality. The activity involves using Python 2.7 (or Sage) to set up a Bernoulli Trial. It also involves setting up a spreadsheet to simulate the Birthday Paradox....
Curated OER
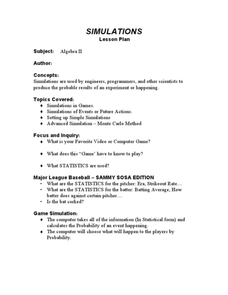
Simulation and Statistics
Students perform simulation of video games as they explore statistics. In this algebra lesson, students relate concepts of statistics and data collection to solve problems. They decide their next step based on the previous assessment of...
Curated OER
Acid Rain Simulation
Young scholars collect data on causes of Acid Rain. In this science lesson, students simulate the effects that produce acid rain, collect and analyze data from their samples. They relate science and statistics in this lesson.
Curated OER
An Introduction to Mathematica and the "Birthday Problem"
Twelfth graders determine the probability of two people in their class sharing the same birthday. In this determining the probability of two people in their class sharing the same birthday problem lesson, 12th graders use...
EngageNY
Ruling Out Chance (part 1)
What are the chances? Teach your classes to answer this question using mathematics. The first part of a three-day instructional activity on determining significance differences in experimental data prompts learners to analyze the...
Curated OER
Fantasy Baseball
Check out this thematic unit, based on the game of baseball. Learners investigate numbers and number relations as they become familiar with some of the basic terminology associated with the game. They focus their attention on actual...
Statistics Education Web
Consuming Cola
Caffeine affects your heart rate — or does it? Learners study experimental design while conducting their own experiment. They collect heart rate data after drinking a caffeinated beverage, create a box plot, and draw conclusions....
Curated OER
Do You Feel Lucky?
Students explore probability by using games based on probable outcomes of events. They name all of the possible outcomes of an event and express the likelihood of such an event occurring.
EngageNY
Ruling Out Chance (part 2)
Help your classes find the significance in this lesson! Learners analyze the probability of Diff values. They then determine if the difference is significant based on their probability of occurrence.
Curated OER
Conditional Probability and Probability of Simultaneous Events
Your statisticians examine the characteristics of conditional probability and the probability of simultaneous independent events. They perform computer activities to find probabilities for simple compound events. They examine the...
EngageNY
Margin of Error When Estimating a Population Proportion (part 2)
Error does not mean something went wrong! Learners complete a problem from beginning to end using concepts developed throughout the last five lessons. They begin with a set of data, determine a population proportion, analyze their result...
Bowland
Speed Cameras
Do speed cameras help reduce accidents? Scholars investigate this question using a series of spreadsheet activities. Along the way, they learn about randomness, probability, and statistical analysis.
Curated OER
What Do We Do With A Dirty Bomb?
Students examine composition of dirty bomb and its possible effects on a city, and investigate simulations of such an event; students use computational and problem solving skills to assess damage and prepare report proposing solution to...
Curated OER
What is a P-value?
Students test the hypotheses using p values. In this statistics instructional activity, students define and examine conditional probability. They test each statement for a true statement or a false statement, based on the sample size.
Curated OER
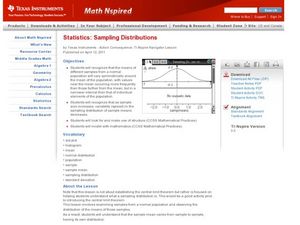
Sampling Distributions
Pupils analyze sampling from different population. For this statistics lesson, students define the meaning of sample sizes and what causes an increase or decrease. They graph their data on the Ti calculator and draw conclusion from the...
Curated OER
Sampling Distribution of Sample Means
Learners collect data and crate a distribution sample. In this statistics lesson, students compare and contrast their collected data. This assignment requires the learners to be comfortable with navigating the internet.
Curated OER
Data Analysis Using Technology
Analyze data using technology. Middle schoolers design data investigations, describe data, and draw their own conclusions. Then they select the best type of graph, graph and interpret the data, and look for patterns in trends. They also...
Curated OER
Designing Models to Simulate Actual Events Using a Table of Random Digits
Students design models to simulate actual events using a tale of random digits. They estimate the likelihood of a particular outcome using results of simulation. Students investigate the uses of statistical methods to analyze data.
Curated OER
Data Analysis and Probability
Students design models to simulate actual events using various random devices. They estimate the likelihood of a particular outcome using results of simulation. In addition, they simulate the births of three children to a using a coin.
Curated OER
Digging for Dirt
Students examine how trash is removed and evaluate statistics related to trash removal. In this trash removal lesson plan, students explore the different methods of trash removal and make an original diagram graphing statistical...
Curated OER
How to Graph in Excel
Fourth graders construct data graphs on the Microsoft Excel program. In this statistics lesson, 4th graders formulate questions and collect data. Students represent their results by using Excel.
Curated OER
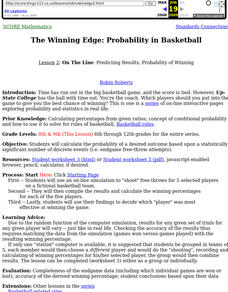
The Winning Edge: Probability in Basketball: Lesson 2
Students calculate the probability of a desired outcome based upon a statistically significant number of discrete events (i.e. endgame free-throw attempts). They participate in an online simulation of basketball free throws.


