Curated OER
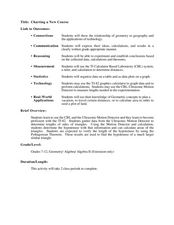
Charting a New Course
Young scholars calculate the distance they will travel. In this geometry lesson, students use the TI and CBL system to make calculation of a certain path. They explore geography by calculating distances between different areas as it...
Curated OER
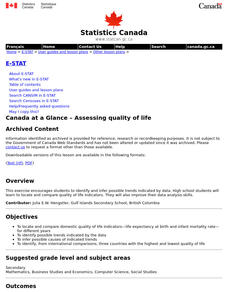
Assessing Quality of Life
Eleventh graders research quality of life indicators for a list of countries looking at such things as infant mortality rate, and gross domestic product. They rank the countries from best to worst regarding quality of life issues.
Curated OER
How Many Is Too Many?
Learners explore the population explosion. They view a video depicting the exponential growth of human population. Students research the internet to project future population data. They perform hands-on, multimedia activities to study...
Math Mammoth
Stem-and-Leaf Plots 3
In this stem-and-leaf instructional activity, students place statistical data in a stem-and-leaf plot. They identify the median, and range in a given set of data. There are four multi-step problems on this one-page instructional activity.
Curated OER
Probability of One Event
In these finding the probability worksheets, students use a dart board, playing cards, and a board game to problem solve. Students solve 17 problems.
Curated OER
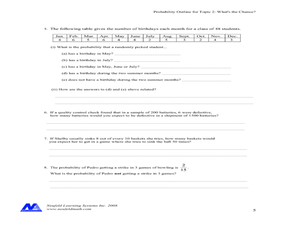
Concept: What's The Chance?
In this concept worksheet, students perform probability experiments. Using collected information, they interpret the data. Students answer questions about probability. This five-page worksheet contains approximately 15 multi-step...
Curated OER
Assessing and Investigating Population Data
Students examine population projections. In this population data lesson, students research and collect data on the population of the United States. They explore and conclude future population growth patterns. Students construct tables...
Curated OER
Candy Problem
In this stats worksheet, students identify how many ways there are to split 25 pieces of candy in between 3 people. There is a very detailed answer key with this problem.
Curated OER
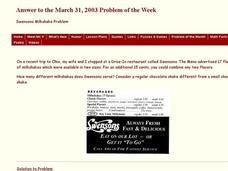
Swensons Milkshake Problemn
In this milkshake activity, students determine the combinations of milkshakes that can be made from the given information. This one-page activity contains 1 problem. The answer is provided.
Curated OER
Permutations, Combinations, and Probability
For this probability-worksheet, 11th graders calculate the permutation, combination and probability of an event occurring. There are 5 questions with an answer key.
Curated OER
Picking Chips: Experimental Probability
Students apply the concepts of an event occurring to playing a game. In this probability lesson,students differentiate between experimental and theoretical probability.
Curated OER
Measuring Dispersion
Students compute the standard deviation for a given set of data. For this measuring dispersion lesson, students compute the mean, and then the distance from the mean for each data point. They find the standard deviation of the data.
Curated OER
Graphing the Past Using Today's Technology
Eighth graders research statistical data regarding their current social studies unit. They write questions about the measures of central tendency, collect and analyze the data, insert the data into a spreadsheet, and generate graphs.
Curated OER
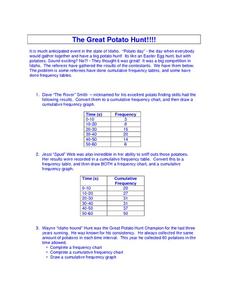
The Great Potato Hunt
In this science learning exercise, middle schoolers examine the data from the potato hunt where potatoes are found like Easter Eggs. The data of the number of potatoes found is recorded in the frequency tables.
Virginia Department of Education
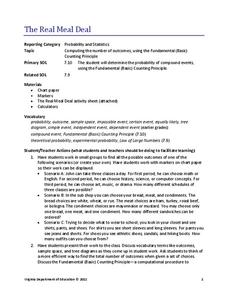
The Real Meal Deal
Burgers and salads and sodas, oh my! Scholars use a menu to investigate the Fundamental Counting Principle. They create tree diagrams to illustrate the number of possible choices for each given scenario.
Curated OER
Measures of Central Tendency
In this measures of central tendency worksheet, learners find the mean, median, and mode of 9 problems given different data sets. Students then solve 2 word problems.
Virginia Department of Education
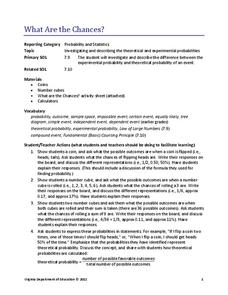
What Are the Chances?
Take a chance on an informative resource. Scholars conduct probability experiments involving coins and number cubes to generate data. Compiling class data helps connect experimental probability to theoretical probability.
Virginia Department of Education
Numbers in a Name
What's in a name? Pupils create a data set from the number of letters in the names of classmates. Each group then takes the data and creates a visual representation, such as a histogram, circle graph, stem-and-leaf plot, etc.
Curated OER
How Are Students Doing on the AP exams?
Students compile and analyze data pertaining to College Credit AP Exams. They pose questions - Which exam is the easiest? - determine answers from their data and display their results.
Curated OER
Checking County Numbers
Students use their county's information page to gather information about their community. Using the information, they create graphs from the tables provided and interpret the data. They write a paragraph showing their interpretation of...
Curated OER
Basketball And Mathematics
Eighth graders collect and analyze data about foul shots taken at basketball games.
Curated OER
Mode Mean Median
In this statistics worksheet, students practice finding number averages and statistics by finding the mode, median, and mean for the number sets.
Curated OER
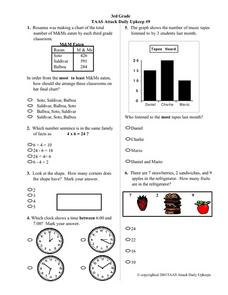
3rd Grade TAAS Attack Daily Upkeep #9
In this math literacy worksheet, 4th graders practice interpreting the pictographs in order to assemble the information to find the solutions to the 13 problems.
Curated OER
Possible Outcomes
In this math literacy worksheet, 6th graders are given one word problem using the data of making slushies and then choose from the possible combinations of flavors.
Other popular searches
- Football Math Statistics
- Baseball Math Statistics
- Math Statistics Simulation
- Math Statistics Survey
- Math Statistics Lesson
- Games Math Statistics
- Math Statistics Histograms
- Sneeze Math Statistics
- Saxon Math Statistics
- Statistics Math Project
- Jeopardy Math Statistics
- Math Statistics Correlation


