Curated OER
Pizza Possibilities
Students create and interpret line plots, bar graphs, and circle graphs. The lesson assumes mastery of conversions from fraction to decimal to percent, construction of angles, and at least an introduction to graphs displaying data.
Curated OER
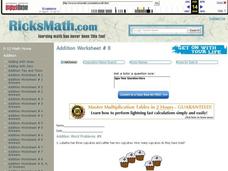
Beginning Addition Word Problems
In this finding the sums of word problems worksheet, young scholars add the one-digit word numbers and numerals and use the pictures to assist them. Students solve four problems.
Curated OER
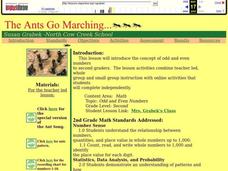
Odd and Even
Explore the concept of odd and even with your class using this resource. Learners take an online test demonstrating their knowledge of odd and even, sing a song about the concept, and engage in computer-based activities.
Curated OER
Matrices: A Secret Weapon
Students perform operations with matrices. In this algebra lesson, students use cryptography and cryptanalysis to solve problems. They add, subtract, and multiply matrices.
Curated OER
Where Does It Come From?
Students explore where agricultural commodities used in snack foods are grown. They choose a snack food and locate the top five states that produce the food that the snack is made from.
Curated OER
Connecting Formulas Related to Geometric Figures
Students identify diagrams of quadrilaterals and circles by different names and classify the figures. They name the areas for each diagram and practice solving the formulas for each.
Curated OER
Detective Digis and the Computer Caper
Mathematicians participate in an hands-on activity to investigate the binary number system and write messages in binary code and have classmates decipher the messages. A said video on the topic does not seem to be available, but the...
Curated OER
One Size Fits All, Part 1
Can you tell how tall someone is just by looking at their feet? In this activity, young mathematicians measure their height, arm span, and foot size, graph their findings, and answer questions about how these measurements are related....
Education World
High, Low, or In Between?
Trios play a card game that reinforces the concepts of number sequence and greater than and less than. Scholars make predictions based on information they know and a single unknown. They see cards drawn by others in the group, but not...
Curated OER
Telling Time to 5 Minutes
In this second grade lesson your class will practice telling time. The goal is to tell time to five minutes using an analog clock. Your young students count by 5 minute intervals and discuss elapsed time.
Curated OER
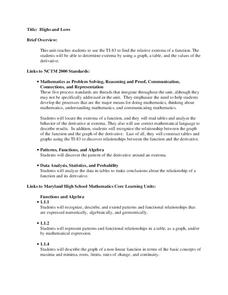
Highs and Lows
Solve problems using integration and derivatives. By using calculus, learners will analyze graphs to find the extrema and change in behavior. They then will identify the end behavior using the derivatives. Activities and handouts are...
Curated OER
China's Population Growth
Learners collect data from China's population growth and determine the mean, median, and mode from the data. In this data lesson plan, pupils determine probabilities and use them to make predictions.
Curated OER
Two-Variable Linear Inequalities
Here is an engaging instructional activity on solving equations with two variables. Have the class rewrite linear equations in the slope intercept form, y=mx + b. They graph the lines using the slope and y-intercepts.
Curated OER
We the People: A Study in American Voter Turnout: US Government
Students examine and compare voter turnout in US Elections. They write a letter to a favorite candidate or representative suggesting ways to increase voter turnout.
Curated OER
Graphing Names in Historic Cemetery
Students collect information from headstones about names of the deceased in their local community. They determine the most common names and graph them. They discuss their findings with the class.
Curated OER
Graph the Results: Applesauce Taste Test
Learners work together to make applesauce following specific directions. They taste each applesauce and graph the results based on the taste test. They also use the internet to create an online graph.
Curated OER
Fire!, Probability, and Chaos
Upper elementary and middle schoolers work with the concept of probability. They are introduced to the concept of chaos. Learners graph and analyze using a line plot, work with mean, and are introduced to the concept of variance.
Curated OER
Box Plots
Young statisticians are introduced to box plots and quartiles. They use an activity and discussion with supplemental exercises to help them explore how data can be graphically represented.
Curated OER
Frame Yourself
Young ratio masters calculate and cut a frame (out of poster board) to accurately create an even frame around a picture of themselves. The frame needs to be proportional to the picture with constraints determined by the instructor.
Curated OER
Marmots: Groundhogs of the World
Students research 14 groundhog species found around the world, including the woodchuck. They use the internet to research groundhogs and students organize their information using a graphic organizer.
Curated OER
Student Costs Data Table
Learners compare and contrast two routes selected for a virtual field trip. They create a data table of educational activities, lodging, and meal costs using Microsoft Excel software.
Curated OER
Virtual Field Trip
This hands-on resource has future trip planners analyze graphs of mileage, gasoline costs, and travel time on different routes. While this was originally designed for a problem-solving exercise using a Michigan map, it could be used as a...
Curated OER
Virtual Field Trip
Are we there yet? Young trip planners learn about their state and plan a trip. They will select sites to see in three cities in their state, and record associated costs in a spreadsheet. While this was originally designed as a...
Curated OER
Shoe Showdown
Third graders use rulers to measure their shoe size in inches and centimeters. They then enter the class shoe measurements into an excel data base and graph the results of both to make the comparison.
Other popular searches
- Football Math Statistics
- Baseball Math Statistics
- Math Statistics Simulation
- Math Statistics Survey
- Math Statistics Lesson
- Games Math Statistics
- Math Statistics Histograms
- Sneeze Math Statistics
- Saxon Math Statistics
- Statistics Math Project
- Jeopardy Math Statistics
- Math Statistics Correlation

