Curated OER
Solving Genetic Puzzles
Seventh graders examine genetics combination using statistics. In this statistics lesson, 7th graders examine genetic trait using a table or punnett square to identify genotype and phenotype. This assignment requires more than one class...
Curated OER
A Statistical Look at Jewish History.
Eighth graders study the relationship between fractions, decimals and percentages by completing activities. In this research analysis lesson, 8th graders look at different websites to figure out Jewish populations in different situations.
Curated OER
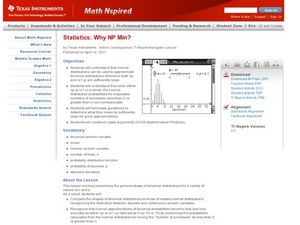
Why NP Min?
Students calculate the normal distribution. In this statistics lesson plan, students use the normal distribution to estimate binomial distributions. They define when to use NP and n(1-p) to make approximations.
Curated OER
Using Mean, Median, Mode, and Range through Basketball
Eighth graders use the sports pages of the newspaper to analyze the mean, median, mode and range of basketball statistics.
Curated OER
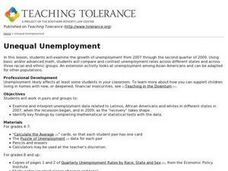
Unequal Unemployment
Young scholars examine unemployment in the United States. In this statistics lesson, students examine data and primary sources regarding unemployment in the United States.
Curated OER
Taking Poll Information
Students investigate the election and poll surveys. In this statistics lesson, students take poll information and analyze the data. They graph their data and make predictions and conjectures.
Curated OER
What Happened to the Mean and Median
Learners find the mean, median and mode. In hs statistics lesson, students collect, plot and analyze data. The identify the effect the central tendency have on the data and line.
Curated OER
What's the Chance?
Students study probability and statistics by conducting an experiment, recording their results, and sharing data with classmates.
Curated OER
Data Handling
In this data handling worksheet, students explore multiple ways to represent data. They create stem and leaf plots, histograms, and bar charts. Students examine and interpret diagrams and statistics. This eleven-page...
Curated OER
Checking Test Comparability/Scattergrams
Students construct a scattergram graph. In this statistics lesson plan, students graph data by hand and using a spreadsheet program. They establish lines of best fit and draw conclusions using their graphs.
Curated OER
Catches and landed value of fish
Students analyze data. In this secondary mathematics lesson, students read and retrieve data from a statistical table on the Canadian fishing industry. Students interpret and describe data in mathematical terms and make...
Curated OER
Minimum, Maximum and Quartiles
In this statistics activity, students identify the different parts of a whisker plot. They find the minimum, maximum and the three different quartiles. There are 8 multiple choice questions with an answer key.
Curated OER
Making Graphs
Students explore statistics by conducting class demographic surveys. In this graph making lesson, students identify the family members of each classmate, pets they own, and favorite activities. Students organize their statistics and...
Curated OER
Collecting and Organizing Data
Fifth graders explore methods of generating and organizing data. Afterward, they visit a specified website where they analyze data, organize, and create graphs. Students follow instructions and complete answers to questions. They...
Curated OER
Worksheet 14: Condorcet Method
In this Condorcet Method worksheet, learners use the Condorcet and Borda Methods to determine the results of given election data. This two-page worksheet contains four multi-step problems.
Curated OER
M&M Math
Students sort a bag of M&M candies according to color using a sorting mat. They count M&M candies. They compare the number to their prediction then students create tally charts.
Curated OER
Mean Meadian and Mode
Students apply central tendencies to given data. In this statistics lesson, students calculate the mean, median, and mode as it relates to their data. They collect data and graph it while identifying the way the numbers are ordered.
Curated OER
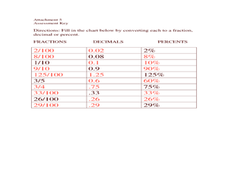
Convert among decimals, fractions, and percents
Seventh graders convert among decimals, percents, and fraction with and without a calculator. In this seventh grade mathematics lesson, 7th graders explore strategies that help them to remember how to perform the needed operation...
Curated OER
The Baby Boom -- How Do We Know it is a Boom?
Young scholars examine graphs of three statistics and use basic math to compute their own. They evaluate the implications of manipulating data and whether statistics are appropriate for creating policy.
Curated OER
An Investigative Task
Students read an article about statistics. In this statistics instructional activity, students are given a detailed overview about statistics and what it entails. This instructional activity is more informational and hands on.
Curated OER
Sample This
Students gain a greater understanding of how statistical samples are conducted by taking polls of specific populations. These polls be expressed in graphs, which be compared with the same questions asked of other populations.
Curated OER
You Are What You Eat (High School)
Students evaluate data from a statistical chart or graph which they find in a newspaper or magazine.
Curated OER
Completing University
Students analyze the pros and cons of completing a 4 year school. In this statistics lesson, students complete surveys and use E-STAT to graph their data. They learn to plot and build diagrams.
Curated OER
Using Current Data for Graphing Skills
Students graph demographic information. In this graphing lesson plan, students choose what type of graph to create and what information to display. Links to examples of graphs and statistical data are provided. The graphs are created on...
Other popular searches
- Football Math Statistics
- Baseball Math Statistics
- Math Statistics Simulation
- Math Statistics Survey
- Math Statistics Lesson
- Games Math Statistics
- Math Statistics Histograms
- Sneeze Math Statistics
- Saxon Math Statistics
- Statistics Math Project
- Jeopardy Math Statistics
- Math Statistics Correlation


