Curated OER
Popcorn Nutrition
Students read a snack nutrition chart and answer questions. They compare nutrition levels of snack foods. They correctly calculate differences in nutritional value.
Curated OER
Finding Averages
Fifth graders explore the world of statistics by finding averages. In this math formula lesson, 5th graders define the terms mean, median and mode while discussing the differences. Students practice finding the different...
Curated OER
Fair Games
Fifth graders examine the statistics of playing games. Many games of chance and activities in maths text books involve rolling two dice and combining the scores, usually by addition. Students often find the probabilities of such events...
Curated OER
Fractions: Jewish Population of Europe during WWII
Students evaluate population maps and convert fractions to percentages. In this WWII lesson, students use statistics on the Holocaust to determine population loss and change. Students create their own math questions and answers using the...
Curated OER
The Fruits of Fairness
Students examine the distribution of wealth in the US. In this economic distribution lesson, students use math skills to apply real statistics to the students in their classroom making these facts more of a reality.
Curated OER
Rocketsmania And Slope
Young scholars use a professional basketball team's data and graph it on a coordinate plane. They draw a line of regression and finding its equation. They access a website containing statistics for the Houston Rockets basketball team to...
Curated OER
Data Analysis, Probability, and Discrete Mathematics: Lesson 4
Eighth graders investigate the concepts of probability while performing data analysis. They apply statistical methods in order to measure or predict some possible outcomes. The information is collected and graphed, 8th graders analyze...
Curated OER
Scientific Graphs
Students organize data collected from their experiments using graphs. In this statistics and biology lesson, students organize their scientific data from an article into readable graphs. They define the usefulness of their graph and...
Curated OER
Batting the Unknown
Students use batting averages to provide a measure of a player's past success. They use Algebra to calculate required performance to improve the average. Students compare baseball batting statistics early in the season and late in the...
Curated OER
Plotting Coordinates on a Cartesian Plane
Students practice identifying points on a coordinate plane, creating charts, and calculating ratios. In groups, students play a "battleship" game where they determine the location of their own fleet and attempt to find the location of...
Curated OER
Discovering Growth Patterns
For this statistics worksheet, students examine data on a variety of subjects related to growth patterns and apply the data to 4 different graphs.
Curated OER
Whirlybirds
Students measure to the nearest centimeter, and predict the frequency of an event. For this statistics lesson, students participate in a simulation of a parachute jump competition by making paper Whirlybirds, and then dropping them...
Curated OER
Scatterplots
For this statistics worksheet, students create a scatter plot based on their analysis of data provided form the space shuttle Challenger disaster. The five page worksheet contains four questions. Answers are not provided.
Curated OER
Potato Ways
Students analyze the packaging process. In this consumer awareness instructional activity, students analyze the process of packaging a potato and identify positive and negative ways of packaging. Students study statistics on an overhead...
Curated OER
!-Survey Project
Young scholars explore the process of the production of statistical information. In this statistical analysis lesson, students design, process and report on a survey of their own creation. ...
Curated OER
What's in the Bag?
Students calculate the probability of an event occurring. In this statistics instructional activity, students calculate the outcome using combination and permutation. They differentiate between-theoretical and experimental probability.
Curated OER
Probability- Many Stage Experiments
Learners list the sample space of an experiment. In this statistics lesson, students calculate the number of favorable outcome in a given sample space. They define and apply mutually exclusive events versus not mutually exclusive events.
Curated OER
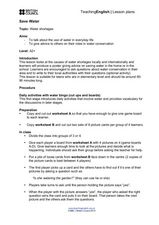
Water Shortages
Learners explore natural elements by participating in a bingo activity. For this water usage lesson, students discuss the importance of clean water and complete worksheets based on water shortage statistics. Learners utilize flashcards...
Curated OER
Class Ketchup
Students describe statistics by conducting a class cooking activity. In this ketchup lesson, students conduct a class survey based on ketchup consumption habits by students. Students utilize tomatoes, water and a bottle to create their...
Curated OER
Skateboard Flex
Middle schoolers examine statistics by completing a skateboard measuring activity. In this flex lesson, students define what skateboard "flex" refers to and identify the proper method of measuring flex by conducting an experiment with...
Pennsylvania Department of Education
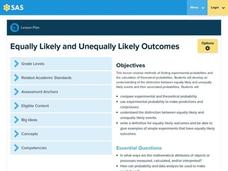
Equally Likely and Unequally Likely Outcomes
Students explore probability. In this statistics/probability lesson plan, students compare experimental and theoretical probability and use experimental probability to make predictions and conjectures. Students explore the...
Curated OER
Weather Tools
Students explore Earth science by participating in a weather identification activity. In this scientific instrument instructional activity, students identify several weather related tools such as the weather vane, thermometer and rain...
Curated OER
Sonics Math
Young scholars multiply whole numbers by fractions. They see one way that decimals apply to the real world, and possibly consider more.
Curated OER
Tech Algebra: A Statistics Study
Students use the internet to gather a minimum of thirty pieces of data. Students create box and whisker graphs, and stem and leaf plots from the information. They calculate mean, median, mode, and range. Students write a summary and...
Other popular searches
- Football Math Statistics
- Baseball Math Statistics
- Math Statistics Simulation
- Math Statistics Survey
- Math Statistics Lesson
- Games Math Statistics
- Math Statistics Histograms
- Sneeze Math Statistics
- Saxon Math Statistics
- Statistics Math Project
- Jeopardy Math Statistics
- Math Statistics Correlation


