Curated OER
Assessing Quality of Life
Eleventh graders research quality of life indicators for a list of countries looking at such things as infant mortality rate, and gross domestic product. They rank the countries from best to worst regarding quality of life issues.
Curated OER
How Many Is Too Many?
Students explore the population explosion. They view a video depicting the exponential growth of human population. Students research the internet to project future population data. They perform hands-on, multimedia activities to study...
Curated OER
NUMB3RS - Season 3 - "Provenance" - Set the Trap
Learners investigate concept of matrices through iteration in this probability lesson. They investigate probability by creating a lesson based on a famous painting. This assignment contains extensions to the...
Curated OER
Finding Domain and Range
In this domain and range worksheet, students observe a graph and identify the domain and range of given functions. Afterwards, they solve functions to identify the range. Fifteen problems are provided on this one-page worksheet.
Curated OER
Global Warming Statistics
Students research and collect data regarding temperature changes for a specific location and find the mean, median, and mode for their data. In this climate change lesson, students choose a location to research and collect data regarding...
Curated OER
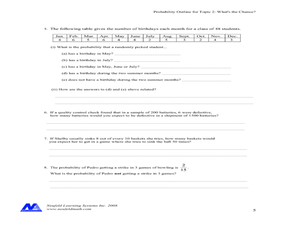
Concept: What's The Chance?
In this concept worksheet, students perform probability experiments. Using collected information, they interpret the data. Students answer questions about probability. This five-page worksheet contains approximately 15...
Curated OER
Measuring Dispersion
Students compute the standard deviation for a given set of data. In this measuring dispersion lesson, students compute the mean, and then the distance from the mean for each data point. They find the standard deviation of the data.
Curated OER
Picking Chips: Experimental Probability
Students apply the concepts of an event occurring to playing a game. In this probability lesson,students differentiate between experimental and theoretical probability.
Curated OER
Graphing the Past Using Today's Technology
Eighth graders research statistical data regarding their current social studies unit. They write questions about the measures of central tendency, collect and analyze the data, insert the data into a spreadsheet, and generate graphs.
Virginia Department of Education
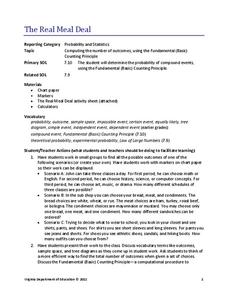
The Real Meal Deal
Burgers and salads and sodas, oh my! Scholars use a menu to investigate the Fundamental Counting Principle. They create tree diagrams to illustrate the number of possible choices for each given scenario.
Virginia Department of Education
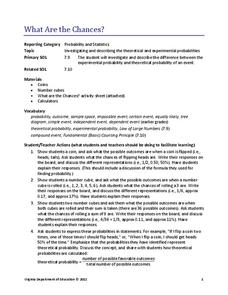
What Are the Chances?
Take a chance on an informative resource. Scholars conduct probability experiments involving coins and number cubes to generate data. Compiling class data helps connect experimental probability to theoretical probability.
Virginia Department of Education
Numbers in a Name
What's in a name? Pupils create a data set from the number of letters in the names of classmates. Each group then takes the data and creates a visual representation, such as a histogram, circle graph, stem-and-leaf plot, etc.
Curated OER
How Are Students Doing on the AP exams?
Students compile and analyze data pertaining to College Credit AP Exams. They pose questions - Which exam is the easiest? - determine answers from their data and display their results.
Curated OER
Checking County Numbers
Learners use their county's information page to gather information about their community. Using the information, they create graphs from the tables provided and interpret the data. They write a paragraph showing their interpretation of...
Curated OER
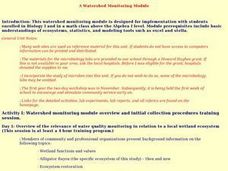
A Watershed Monitoring Module
Students explore the relevance of water quality monitoring in relation to a local wetland ecosystem. They conduct standard water quality tests using wet tests and CBL calculators and probes. Student record and interpret the results.
Curated OER
Basketball And Mathematics
Eighth graders collect and analyze data about foul shots taken at basketball games.
Curated OER
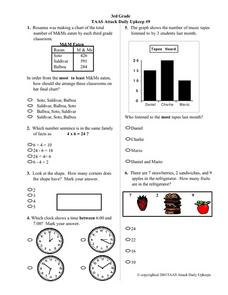
3rd Grade TAAS Attack Daily Upkeep #9
In this math literacy worksheet, 4th graders practice interpreting the pictographs in order to assemble the information to find the solutions to the 13 problems.
Curated OER
Possible Outcomes
In this math literacy worksheet, 6th graders are given one word problem using the data of making slushies and then choose from the possible combinations of flavors.
Curated OER
The Household Environment Survey
Pupils examine data collected from a national survey of household environmental practices to develop their own questionaires. Once they have their own survey questions, students conduct their own investigations, and report their findings.
Curated OER
"M&Ms"® Candies Worksheet 1
In this math worksheet, students find the likelihood of different outcomes with the use of M and M's candy for the seven questions and fill in the graphic organizer.
Curated OER
Possible Outcomes 6
For this math worksheet, 6th graders make predictions of the possible outcomes using the data taken from two word problems. The answers are chosen from the outcomes that are possible using the multiple choice format.
Curated OER
Probability
For this math literacy worksheet, pupils solve the four problems related to the concept of probability using the multiple choice format.
Curated OER
Coyote Cafe
In this math worksheet, learners read the word problems and write down the possibilities of possible servings. The outcomes are plotted using a graphic organizer.
Curated OER
Stem and Leaf Plots
In this math worksheet, students organize data into stem and leaf plots. They select the correct stem to use to organize the data. Students analyze the data on a given stem and leaf plot.
Other popular searches
- Football Math Statistics
- Baseball Math Statistics
- Math Statistics Simulation
- Math Statistics Survey
- Math Statistics Lesson
- Games Math Statistics
- Math Statistics Histograms
- Sneeze Math Statistics
- Saxon Math Statistics
- Statistics Math Project
- Jeopardy Math Statistics
- Math Statistics Correlation
