EngageNY
Equations for Lines Using Normal Segments
Describing a line using an algebraic equation is an essential skill in mathematics. The previous lesson in the series challenged learners to determine if segments are perpendicular with a formula. Now they use the formula to determine...
EngageNY
Equations for Tangent Lines to Circles
Don't go off on a tangent while writing equations of tangent lines! Scholars determine the equations for tangent lines to circles. They attempt both concrete and abstract examples, such as a tangent line to the unit circle through (p, 0).
EngageNY
Vectors and the Equation of a Line
Represent linear equations in both two and three dimensions using parametric equations. Learners write parametric equations for linear equations in both two and three variables. They graph and convert the parametric equations to...
Curated OER
Systems of Equations: What Method Do You Prefer?
Students explore the concept of solving systems of equations. In this solving systems of equations lesson, students watch YouTube videos about how to solve systems by graphing and by elimination. Students use an interactive website to...
Wordpress
Introduction to Exponential Functions
This lesson begins with a review of linear functions and segues nicely over its fifteen examples and problems into a deep study of exponential functions. Linear and exponential growth are compared in an investment task. Data tables are...
Curated OER
Linear and Quadratic System
Learners find the common point of a linear and quadratic system given a graph of the system. Then they find a specific point located only on the parabola.
Curated OER
How Long Can You Go?
Eighth graders examine the usefulness of a line of best fit by collecting and graphing data, using a graphing calculator to determine the line of best fit, and making a variety of predictions. They watch a video, then design a...
CPM
Cones and Spheres
Geometry whizzes solve and complete 24 different problems that include determining the volume and surface area of spheres and cones. First, they use the given information to determine the volume of a cone. Then, pupils use the given...
Curated OER
Taxi!
Your young taxi drivers evaluate and articulate the reasoning behind statements in a conceptual task involving linear data. The given data table of distances traveled and the resulting fare in dollars is used by learners to explore...
BW Walch
Solving Systems of Linear Equations
Solving systems of equations underpins much of advanced algebra, especially linear algebra. Developing an intuition for the kinds and descriptions of solutions is key for success in those later courses. This intuition is exactly what...
University of Texas
A Library of Parent Functions
Don't think this lesson is for Mom and Dad; parent functions are all for your high schoolers. Flip through a presentation with a focus slide on each type of graph and its characteristics. Some examples are included but the focus is on...
Curated OER
Influence and Outliers
Using the TI-Nspire calculator, statisicians identify outliers and their effect on the least-squares regression line. In finding the line of best fit, they determine what points will affect the least squares regressions and what points...
Curated OER
Graphing Systems of Inequalities
Solve equations and graph systems of inequalities. Designed as a lesson to reinforce these concepts, learners revisit shading and boundaries along with solving linear inequalities.
Curated OER
Unit Squares and Triangles
This is an interesting geometry problem. Given the figure, find the area of a triangle that is created by the intersecting lines. The solution requires one to use what he/she knows about coordinate geometry, as well as triangle and angle...
Alaska Department of Education
Mathematics Reference Sheet
Triangles and prisms don't stand a chance when your learners use this handout full of the formulas they need to know about the different shapes. Area, volume, and surface formulas are all covered along with the standard measurement and...
Illustrative Mathematics
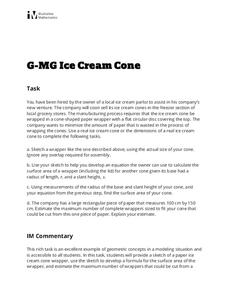
Ice Cream Cone
Every pupil with a sweet tooth will be clamoring for this lab and analysis, particularly when they're allowed to eat the results! Volume and surface area formulas for cones are developed from models, and then extended to the printing of...
West Contra Costa Unified School District
Graphing Systems
Get hands on with solving systems of equations graphically. A solid lesson plan uses guided practice to show how to solve systems of linear equations. It allows time for sharing ideas and provides a printable matching activity to promote...
Curated OER
Geometry Project
Proofs are usually an intimidating assignment. An engaging lesson focused on geometric proofs may reduce the anxiety! Pupils choose between several triangle proofs to complete and work on completing them. The assignment also gives a...
Mt. San Antonio Collage
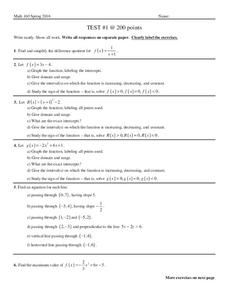
Test 1: Graphing Functions
Graph the night away with all the different types of functions provided in the activity. Linear, quadratic, and rational all ask for graphs, domain and range and other key factors about the functions.
CPM
Direct, Joint, and Inverse Variation
Here is a quick guide to direct, joint, and inverse variation used in realistic situations. Each topic has a page of notes and examples followed by practice problems. The resource explains each type of variation and provides their...
Willow Tree
Scatterplots and Stem-and-Leaf Plots
Is there a correlation between the number of cats you own and your age? Use a scatter plot to analyze these correlation questions. Learners plot data and look for positive, negative, or no correlation, then create stem-and-leaf plots to...
Willow Tree
Approximating a Line of Best Fit
You may be able to see patterns visually, but mathematics quantifies them. Here learners find correlation in scatterplots and write equations to represent that relationship. They fit a line to the data, find two points on the line, and...
EngageNY
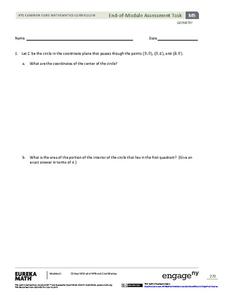
Geometry Module 5: End-of-Module Assessment
The lessons are complete. Learners take an end-of-module assessment in the last installment of a 23-part module. Questions contain multiple parts, each assessing different aspects of the module.
EngageNY
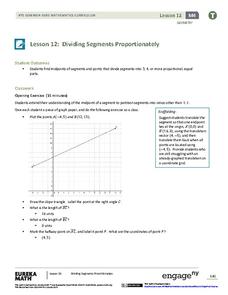
Dividing Segments Proportionately
Fractions, ratios, and proportions: what do they have to do with segments? Scholars discover the midpoint formula through coordinate geometry. Next, they expand on the formula to apply it to dividing the segment into different ratios and...
Other popular searches
- Math Slope Puzzle
- Math Slope Game
- Slope Math
- Math Slope Coordinate Plane
- Anticipatory Set Math Slope
- Math Slope Projects
- Math Slope Intercept


