Hi, what do you want to do?
Math Is Fun
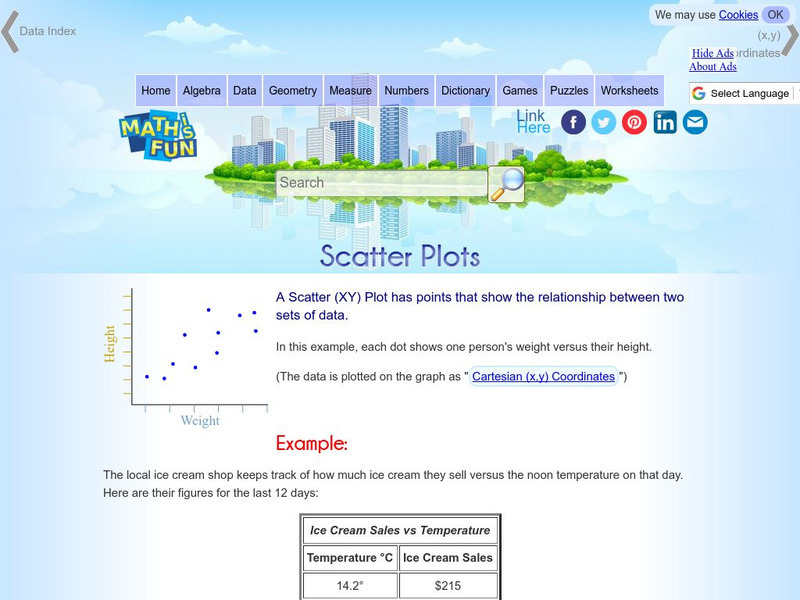
Math Is Fun: Scatter Plots
Explains, with examples, what scatter plots are and how to interpret the data. Discusses trends, interpolation and extrapolation, and correlation. Includes a set of practice questions.
Quia
Ixl Learning: Scatter Plots
Brush up on your math skills relating to scatter plots then try some practice problems to test your understanding.
Other
Nearpod: Construct & Interpret Scatter Plots
In this lesson on scatter plots, 8th graders will learn how to interpret scatter plots and then graph them using a data table.
Khan Academy
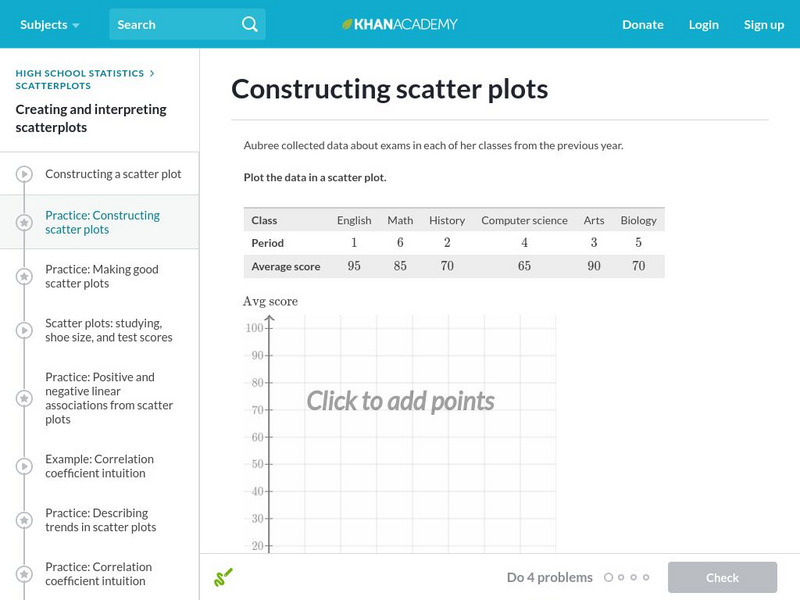
Khan Academy: Constructing Scatter Plots
Practice plotting points to construct a scatter plot. Students receive immediate feedback and have the opportunity to try questions repeatedly, watch a video, or receive hints.
Khan Academy
Khan Academy: Describing Trends in Scatter Plots
Practice making sense of trends in scatter plots. That is, explain what trends mean in terms of real-world quantities. Students receive immediate feedback and have the opportunity to try questions repeatedly, watch a video, or receive...
Texas Instruments
Texas Instruments: Math Today for Ti: Is Leisure Time Really Shrinking
Students will to organize data from the USA TODAY Snapshot, "Is leisure time really shrinking?," into two scatter plots and determine the quadratic model for each scatter plot. Students will determine if these graphs intersect and learn...
University of Waterloo (Canada)
Univ. Of Waterloo: Wired Math: Linear Graphing: Graphing and Analyzing [Pdf]
The mathematics resource assesses students on linear relations. The activity has problems with graphing and analyzing linear relations. Some of the topics included are variation, scatter plots and linear relationships. The worksheet has...
Texas Instruments
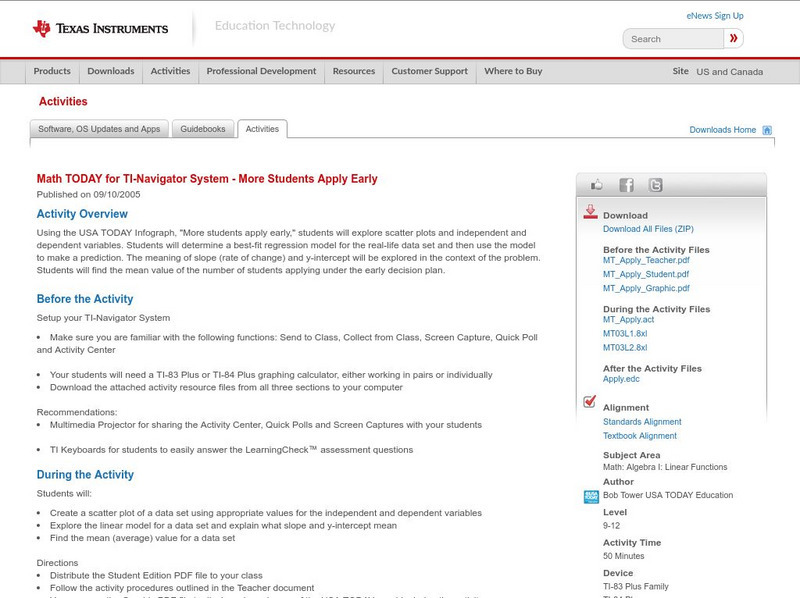
Texas Instruments: Math Today for Ti Navigator System: More Students Apply Early
Using the USA TODAY Infograph, "More students apply early," students will explore scatter plots and independent and dependent variables. Students will determine a best-fit regression model for the real-life data set and then use the...
Shmoop University
Shmoop: Basic Statistics & Probability: Scatter Plots & Correlation
The statistics resource explores scatter plots and correlation. Students learn about the concepts through notes and detailed examples. The resource consists of practice exercises to check for comprehension of the topics.
National Council of Teachers of Mathematics
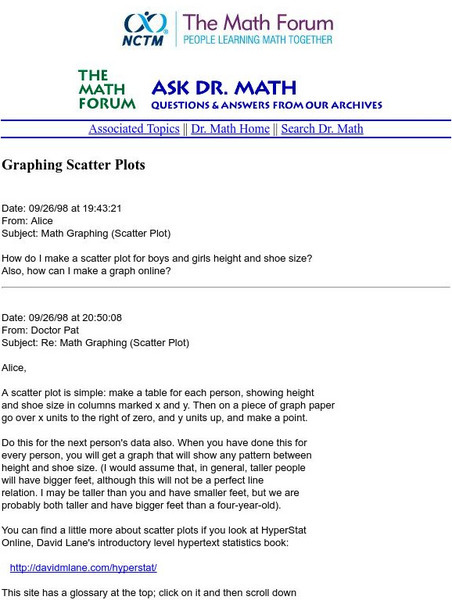
The Math Forum: Nctm: Ask Dr. Math: Graphing Scatter Plots
This page is in response to a question that someone emailed Dr. Math. It shows how to make a scatter plot for peoples' height and shoe sizes. The information is somewhat brief, but worth checking out on the subject.
National Council of Teachers of Mathematics
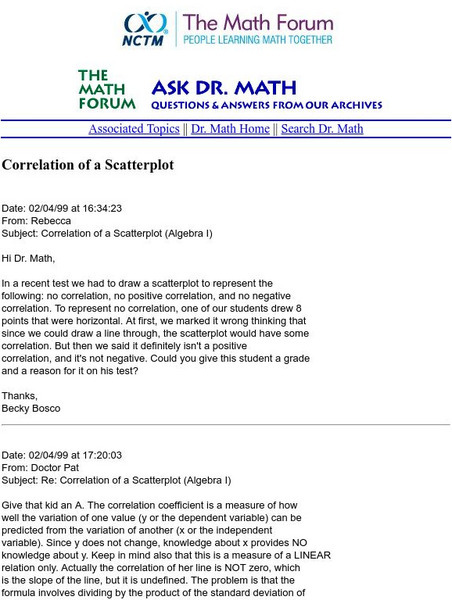
The Math Forum: Nctm: Ask Dr. Math: Correlation of a Scatterplot
This page from Ask Dr. Math describes the correlation of a scatterplot and gives an example of one with no correlation.
Shodor Education Foundation
Shodor Interactivate: Simple Plot
A java applet that helps a student to create a scatter plot using the coordinates and axes and given data.
Math Graphs
Houghton Mifflin: Math Graphs: Fitting Models to Scatter Plots 5 [Pdf]
Students evaluate a scatter plot to determine the relationship between two variables. The scatter plot is available in PDF format.
Math Graphs
Houghton Mifflin: Math Graphs: Fitting Models to Scatter Plots 6 [Pdf]
Learners evaluate a scatter plot to determine the relationship between two variables. The scatter plot is available in PDF format.
Math Graphs
Houghton Mifflin: Math Graphs: Fitting Models to Scatter Plots 1 [Pdf]
Students use a scatter plot to determine whether data can be modeled by a linear function, a quadratic function, a trigonometric function, or that there appears to be no relationship between x and y. The resource consists of an enlarged...
Math Graphs
Houghton Mifflin: Math Graphs: Fitting Models to Scatter Plots 2 [Pdf]
Students use a scatter plot to determine whether data can be modeled by a linear function, a quadratic function, a trigonometric function, or that there appears to be no relationship between x and y. The resource consists of an enlarged...
Math Graphs
Houghton Mifflin: Math Graphs: Fitting Models to Scatter Plots 3 [Pdf]
Students use a scatter plot to determine whether data can be modeled by a linear function, a quadratic function, a trigonometric function, or that there appears to be no relationship between x and y. The resource consists of an enlarged...
Math Graphs
Houghton Mifflin: Math Graphs: Fitting Models to Scatter Plots 4 [Pdf]
Students use a scatter plot to determine whether data can be modeled by a linear function, a quadratic function, a trigonometric function, or that there appears to be no relationship between x and y. The resource consists of an enlarged...
Math Graphs
Houghton Mifflin: Math Graphs: Fitting Models to Scatter Plots 7 [Pdf]
Learners use a given scatter plot to identify whether the data can be modeled by a linear, quadratic, or trigonometric function. The math graph is available in PDF format.
Math Graphs
Houghton Mifflin: Math Graphs: Fitting Models to Scatter Plots 8 [Pdf]
Learners use a scatter plot to identify whether the data can be modeled by a linear, quadratic, or trigonometric function. The math graph is available in PDF format.
Texas Instruments
Texas Instruments: Math Today Is Leisure Time Really Shrinking?
Students will have the opportunity to organize data from the USA TODAY Snapshot "Is leisure time really shrinking?" into two scatter plots and determine the quadratic model for each scatter plot.
Texas Instruments
Texas Instruments: Math Today More of Us
In this activity students will investigate exponential functions and their graphs using real-life data. Students will analyze population data for the United States and create an exponential model for the scatter plot.
Texas Instruments
Texas Instruments: Math Today: Internet Subscribers Soar
Students will create a scatter plot of the number of Internet subscribers during 2004 through 2008 using the USA TODAY Snapshot "Internet phone subscribers soar." This activity will allow students to explore real-life data that will be...
Texas Instruments
Texas Instruments: Mc Dougal Littell Middle School Math: Making Data Displays
Students will create data displays using a scatter plot and a line graph of the data and a circle graph of survey data.


