American Statistical Association
Bubble Trouble!
Which fluids make the best bubbles? Pupils experiment with multiple fluids to determine which allows for the largest bubbles before popping. They gather data, analyze it in multiple ways, and answer analysis questions proving they...
Shodor Education Foundation
Marbles
Grab some marbles from a bag. The applet simulates drawing marbles from a bag. Pupils determine the number of four colors of marbles in a bag and how many marbles to draw. Using information on whether order matters in the draw and if...
Shodor Education Foundation
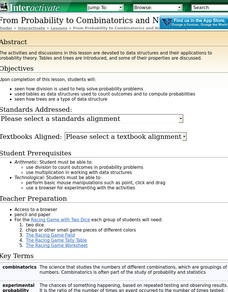
From Probability to Combinatorics and Number Theory
What middle schooler does not enjoy an occasional online game? In this lesson plan play, you will find embedded links to an online probability game, and informative pages about how division is used in probability, the concept of tree...
Curated OER
Rounding Decimals
Fourth graders engage in a lesson that is about the concept of rounding decimals. They review place value and focus it upon the practice of rounding. Students use 10 base decimal grids or models to help make connections with the skill.
Curated OER
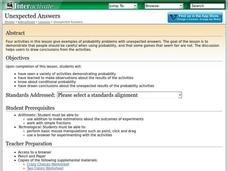
Unexpected Answers
Students explore the concept of fairness. In this fairness lesson, students play four probability games. Students determine who has the best chance of winning each of the four games. Students discuss which games gave an unfair advantage.
Illustrative Mathematics
How Many Buttons?
Bring the class into the probability by having everyone count buttons on their shirts. Organize the data into the chart provided and chose different possibilities such as "female with one button" or "all learners with more than four...
Curated OER
Texting and Grades II
Given the least squares regression line, interpret the slope and intercept in the context of the relationship between texting and GPA. Although this task is short and looks simple, some subtle points can be brought to light in a...
Curated OER
Make a Frequency Table and a Histogram for a Given Set of Data
In this data recording and data organization worksheet, students create one frequency table and one histogram for a given list of data. Explanations and examples for frequency tables and histograms are given.
Curated OER
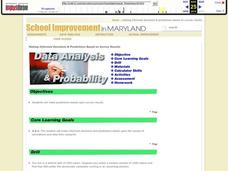
Data Analysis & Probability
High schoolers make predictions based on survey results. They calcuate sample proportions. Students estimate the number of voters in their district preferring the democratic candidate using their sample results. They review sample...
Curated OER
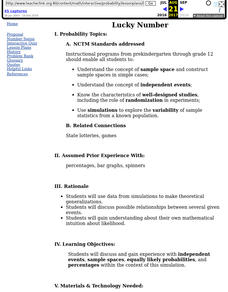
Lucky Number
Students use data from simulations to make theoretical generalizations. They discuss possible relationships between several given events and gain understanding about their own mathematical intuition about likelihood.
Curated OER
M&M Statistics
Students determine the difference between guessing and making a prediction. They discuss what they could graph using a bag of M&M's. They take a Raw data sample and convert it into a sample. They graph the actual results and combine...
Curated OER
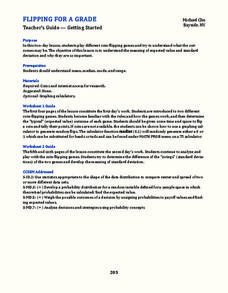
Flipping for a Grade
What happens when your teachers get tired of grading tests and want to use games of chance to determine your grade? How would you decide which game they should play? Learn how to use expected value and standard notation to compare two...
Shodor Education Foundation
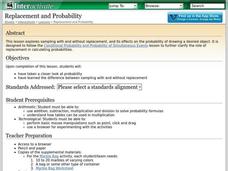
Replacement and Probability
Middle and high schoolers explore the concept of probability. In this probability lesson, learners conduct an experiment with a bag of marbles. Pupils draw marbles from a bag and determine the probability of drawing a particular color...
Curated OER
Seeing Is Believing
Students investigate the concepts of probability. They use data to find the central tendency, median, and mode. Students design and play a game in order to practice the concepts. They also complete a table with data that is analyzed.
Shodor Education Foundation
Introduction to the Concept of Probability
Acquaint mathematicians to the concept of probability with a discussion about the results of a game. Then have them play a dice, card, spinner, or coin game and recording the number of wins vs. the number of tries on an interactive web...
Curated OER
Hypothesis Testing: Claim on Mean; Population Standard Deviation Unknown
In this statistics worksheet, students test given claims using traditional methods of hypothesis testing. Students assume that sampling is randomly generated.
Curated OER
Area graphics for 7th graders
Students randomly select dimensions for three geometric shapes (square, right triangle and circle). From the graphs they compare and contrast the graphical results of each shape.
Curated OER
Grabbing CDs
Third graders determine the likelihood of an event. They randomly choose two CD's from a rack of eight. They determine all the combinations of CD's they can make and explain how they know when they have found all the combinations.
Curated OER
Data Analysis and Bias
In this probability and statistics instructional activity, students determine when a collected data or a graph of the data could be biased. The one page instructional activity contains four multiple choice questions. Answers are...
Alabama Learning Exchange
Pennies, Pennies and More Pennies
Learners determine the number of pennies needed to fill a room. In this pennies lesson plan, students work in groups to determine the number of pennies needed to fill a room. They compute the probability of the head of a pin landing on...
Curated OER
Asthma Survey
Students collect survey data on the prevalence of asthma in a community. They summarize and display the survey data in ways that show meaning.
Curated OER
One, Two, Three...and They're Off
Students make origami frogs to race. After the race they measure the distance raced, collect the data, enter it into a chart. They then find the mean, median, and mode of the data. Next, students enter this data into Excel at which time...
Curated OER
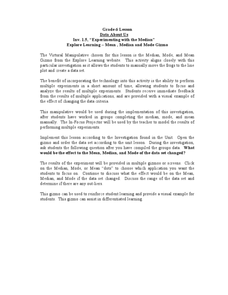
Explore Learning - Mean , Median and Mode Gizmo
Sixth graders experiment with mean, median, and mode. In this online interactive mean, median, and mode lesson, 6th graders analyze the results of multiple experiments and after they work in groups completing the median, mode, and mean...
Curated OER
Ecology - Biodiversity Lab
Studnents examine the degree of biodiversity that exists in one's everyday environment, in order to develop an understanding of how scientists classify organisms and to explain why biodiversity is important for living things.


