Curated OER
Algebra: Do You See What I See?
Students discover how to find the mean, median, and mode from sets of data. By using statistical techniques such as whisker plots and bar graphs, they display the data gleaned from problems. Individually, students complete projects...
Curated OER
Expected Value
Students explore expected value, are introduced to the concept of varying payoffs, and have used a computer simulation of a "real world" example where expected value is used
Curated OER
Pumped Up Gas Prices
Young scholars spend one month keeping track of the mileage and gasoline amounts they or their family has used. Information is entered into a spreadsheet to help calculate the average gas prices over time.
Curated OER
MOBILITY, Traveling Lightly: What’s My Footprint?
Students calculate their carbon footprint. In this environmental technology lesson, students listen to a lecture on climate change. Students brainstorm solutions to reduce environmental impact based on travel options. Students calculate...
Curated OER
Calculating Range for a Constant Velocity
Students read an explanation from the NASA Web-based "textbook", The Beginner's Guide to Aerodynamics, then use the information in combination with data from other Web sites to solve single variable equations for distance (range), time,...
Curated OER
Properties of Fractals
Students build a working definition of regular fractal, look carefully at the concepts of dimension and scale, and are introduced to logarithms. They solve simple exponential equations for the exponent both by trial and error and using...
Curated OER
Properties of Fractals
Students build a working definition of a regular fractal, they measure the concepts of dimensions and scale, they explore the concept of a logarithm and they attempt to solve simple exponential equations for the exponent both by trial...
Curated OER
Teaching the Toki Kaku Dako
Learners complete various readings and decorating, constructing, and flying a kite. They analyze how the parts of a system to together. Students comprehend the concept of area.
Curated OER
Graphs
Learners graph ordered pairs to model the relationship between numbers. After observing the patterns in ordered pairs, they describe the relationship, and create graphs from a data table. Students describe intervals in the graph, and...
Curated OER
Playground Mapping
Students convert their physical models of a playground from a previous lesson into a map of the playground that includes a scale and key. They examine and discuss examples of maps, view an image to map photo essay, and create a map using...
Curated OER
Mapping River Statistics
Students research different statistics to do with the Mississippi River. They answer questions about finding data and collect it by conducting research. The research is used to construct a data table. Then students use the table to...
Curated OER
Cause and effect Relationship
Students examine folk’s tales for Cause and Effect. In this literature lesson, students read "The Origin of Fire" and "The Origin of Medicine” and look for cause and effect. They use a TI Navigator to write down their findings.
Curated OER
Let's Take a Trip!
Sixth graders plan trip for family of four, and choose best travel plan by studying maps, considering different routes, and visiting Web sites to get airline and travel schedules.
Curated OER
Money Circulation: A Story of Trade and Commerce
Students are introduced to the meaning, symbolism, and value of the quarter. They determine the percentage of total monetary value held in quarters and graph the results. Students infer about the U.S. Mint's distrubution of coins. They...
Curated OER
Playground Mapping
Students review their physical models of the objects on their playground at school. Using the model, they convert it into a map with a scale and key. To end the instructional activity, they use the map to locate different objects and...
Curated OER
Milky Way Galaxy
Students simulate stars in the Milky Way Galaxy using newspaper prints. In this space science lesson, students compare the number of 'stars' on their page to familiar things. They calculate how many pages they need to have the same...
Curated OER
Pumped Up Gas Prices
High schoolers investigate the concepts of differing gas prices and how they are set in different geographical areas. They conduct research about the economic concepts of supply and demand and predict the outcomes upon the prices of...
Curated OER
Travel to the Polar Lands
Second graders receive an "Expedition Ticket" to travel through the Polar Regions- the Arctic and the Antarctic. They research polar bears and make drawings that are to scale.
Curated OER
Teaching the Kono Salmon Kite
Students complete several student readings involving kite making and kite flying. They analyze how the parts of a system go together and how these parts depend on each other. They comprehend how different environments both provide...
Texas Education Agency
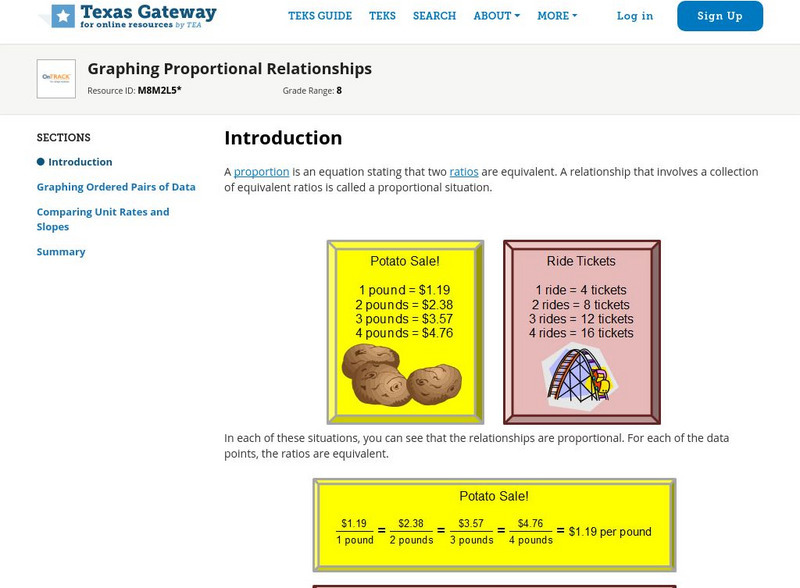
Texas Gateway: Graphing Proportional Relationships
Given a proportional relationship, students will be able to graph a set of data from the relationship and interpret the unit rate as the slope of the line.
McGraw Hill
Glencoe: Self Check Chapter Test Using Proportional Reasoning
The mathematics resource consists of an assessment with hints and solutions. Students answer questions that review proportional reasoning.
Khan Academy
Khan Academy: Identify Proportional Relationships From Graphs
Practice identifying proportional relationships from graphs.
PBS
Pbs Mathline: Bead Dazzling (Proportional Reasoning) [Pdf]
A comprehensive instructional activity on algebraic thinking where learners create and identify patterns using proportional reasoning. Research based, this instructional activity includes technology connections, items for discussion, and...
Thinkport Education
Math by Design: Proportional Reasoning [Pdf]
Learners will understand how to use proportional reasoning in measurement problems.


![Pbs Mathline: Bead Dazzling (Proportional Reasoning) [Pdf] Lesson Plan Pbs Mathline: Bead Dazzling (Proportional Reasoning) [Pdf] Lesson Plan](https://content.lessonplanet.com/knovation/original/114246-c0ff81bc865fdf767397fcd7c31f2652.jpg?1661409083)
![Math by Design: Proportional Reasoning [Pdf] Lesson Plan Math by Design: Proportional Reasoning [Pdf] Lesson Plan](https://static.lp.lexp.cloud/images/attachment_defaults/resource/large/FPO-knovation.png)