Virginia Department of Education
May I Have Fries with That?
Not all pie graphs are about pies. The class conducts a survey on favorite fast food categories in a lesson on data representation. Pupils use the results to create a circle graph.
EngageNY
Summarizing a Data Distribution by Describing Center, Variability, and Shape
Put those numbers to work by completing a statistical study! Pupils finish the last two steps in a statistical study by summarizing data with displays and numerical summaries. Individuals use the summaries to answer the statistical...
EngageNY
Solve for Unknown Angles—Transversals
Lead your class on an exciting journey through the world of math as they review geometry facts and solve for unknown angles. They learn how to use auxiliary lines and congruent angles to correctly complete each practice problem...
Shodor Education Foundation
InteGreat
Hands-on investigation of Riemann sums becomes possible without intensive arithmetic gymnastics with this interactive lesson plan. Learners manipulate online graphing tools to develop and test theories about right, left, and...
Virginia Department of Education
Circles in the Coordinate Plane
Make the connection between the distance formula and the equation of a circle. The teacher presents a instructional activity on how to use the distance formula to derive the equation of the circle. Pupils transform circles on the...
Curated OER
Math in Society
Twelfth graders determine probabilities of real-life events such as life expectancies, winning a lottery ticket and the break-even premium. They apply how life-expectation tables are used to estimate the probability that an individual...
Curated OER
Expected Outcome (Probability)
Young scholars practice and determine expected values of experiments as well as distributions of experiments. They find the area of rectangles and circles and determine elementary probabilities. Probability exercises begin with quarters...
Curated OER
EMS Lesson 2: Outrageous Offspring
Students investigate the principles of probability that can be used to predict hereditary traits.
Curated OER
Probability- Many Stage Experiments
Learners list the sample space of an experiment. In this statistics lesson, students calculate the number of favorable outcome in a given sample space. They define and apply mutually exclusive events versus not mutually exclusive events.
Curated OER
Probably or Probably Not?
Students utilize the interactive spinner and write down the probability of each color in reduced fraction form in the "Experimental Results" column, labeling each color and its corresponding probability in the same order as in the...
Curated OER
Probability Two Events
Young scholars investigating the concept of probability practice the concept using a variety of different example problems. The lesson is delivered in a question and answer format. The frequency of answers is recorded in a data table for...
Curated OER
The Old Lady and Probability
First graders practice probability by playing various games associated with song There Was an Old Lady.
Education World
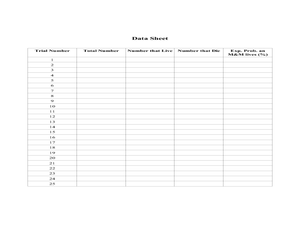
The Probability of Color
For this home activity worksheet, 3rd graders will focus on probability. Students will complete a chart of colors using a bag of M &Ms.
Curated OER
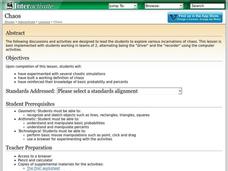
Chaos
Learners explore the concept of probability. In this probability lesson, students use a applet that demonstrates chaos and probability of spread for a forest fire. Learners also play applets about the Game of Life and Rabbits and Wolves,...
Curated OER
Probability and Statistics
Students are taught to search the internet for statistics concepts on sports. In this probability lesson, students collect data and use the calculator to graph and analyze their data. They graph and make predictions about sports using...
Curated OER
Analyze This
Sixth graders use a video and the internet to determine whether a game is fair or unfair. In this probabilities lesson plan, 6th graders determine the fairness of a game based on the probabilities of the outcomes.
Curated OER
Chances Are...
Students examine the probability of an event. In this probability lesson, students determine whether it is likely that an event will occur in coin flipping activities. They work with two and four coins, and one die in three different...
Curated OER
Algebra/Geometry Institute 2007
Fifth graders practice calculating probability using statistics. In this math statistics lesson plan, 5th graders discover the meanings of the terms unlikely, likely, eventually, and chance, when asked to answer questions about the...
Curated OER
The Monty Hall Problem
Students define and differentiate between experimental and theoretical probability. In this statistic lesson, students play the game "Monty Hall" and use probability to come up with the best strategies to play the game.
Curated OER
RIP M&M's
Students solve theoretical probability problems. In this algebra lesson, students apply the concept of probabilities to solving real life scenarios. They collect data and graph it using experimental probability.
Curated OER
Shake It Up with Scatterplots
Learners identify how to use a scatterplot to compare two sets of data to determine if they are related. Then they identify and describe the definition of regression line (the "line of best fit"). Students also identify how scientists...
Curated OER
Drawing Bugs Game
Second graders explore probability by playing a drawing game with dice. After they roll a die, they draw a tree diagram to illustrate each of the possible outcomes.
Curated OER
Mean Meadian and Mode
Students apply central tendencies to given data. In this statistics lesson, students calculate the mean, median, and mode as it relates to their data. They collect data and graph it while identifying the way the numbers are ordered.
Curated OER
Snack Sack
First graders, after exploring agricultural products that can be considered snack foods, experience the concepts of ratio and probability. They analyze and record their class experience after dealing with the following snacks: peanut...
Other popular searches
- Probablity Math Lessons
- Probability Math Lessons
- Math Lessons Probabilities
- Math Lessons/ Probability
- Math Lessons on Probability


