Arizona State University
Roundup Shapes
Let's study 2-D shapes! Young mathematicians compare and classify shapes according to attributes. They evaluate shape riddles and predict the shape being described. Here is the website where you can find the lesson...
Curated OER
Mean Absolute Deviation in Dot Plots
The lesson plan focuses on the ideas of dot plot representations and the mean absolute deviation of data sets.
Curated OER
Adding and Subtracting Algebraic Expressions (Combining Like Terms)
Everyone loves math when it includes food! This lesson tries to take the notion of combining like terms in algebra and comparing it to sorting apples and oranges. It takes a step-by-step approach to helping young scholars understand this...
Curated OER
How Do You Measure Up?
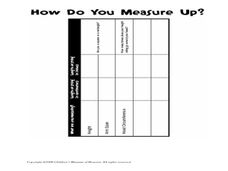
Students measure their body. In this measurement lesson plan, students use a string to measure their height and the circumference of their head. They record this information on the worksheet provided and answer questions as a group.
Curated OER
Children's Museum of Houston - Pre/Post Classroom Activities - Nets
Students make three dimensional shapes with nets. In this nets lesson, students receive nets which they fold to make a three dimensional object. They predict what shape each net will make and verify it after making the net. They use the...
Curated OER
Area of Polygons
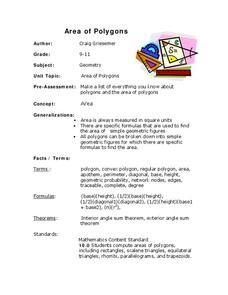
Students engage in a lesson plan that is about the concept of polygons and focuses upon finding the area. They use formulas provided in the lesson plan in order to solve problems given by the teacher for independent practice. Geometric...
Curated OER
Using Graphology to Teach Traditional Writing
Introduce your class to the narrative, descriptive and expository forms of writing. In groups, they discuss the personality of the author while graphing the characteristics after reading different examples from the same writer. To end...
Curated OER
Maps and Modes, Finding a Mean Home on the Range
Fifth graders investigate data from maps to solve problems. In this data lesson, 5th graders study maps and collect data from each map. Students present their data in a variety of ways and calculate the mode, mean, median, and range.
Curated OER
Antacid Tablet Race
Students complete experiments to determine how rocket fuel is affected by surface area and temperature. They compare the reaction rates of antacid tablets. They discuss their results to complete the lesson.
Illustrative Mathematics
Voting for Two, Variation 2
John won the election, but by how much more? Your learners will calculate how many votes each candidate received in order to determine the difference. Use with other lessons provided in the series to practice different variations of this...
Curated OER
What's the Chance?
Students conduct probability experiments with dice and coins. They watch a video for a variety of situations where calculating the probability is complicated by total number of possibilities. They solve problems presented in the video.
Pennsylvania Department of Education
Equally Likely and Unequally Likely Outcomes
Students explore probability. In this statistics/probability lesson plan, students compare experimental and theoretical probability and use experimental probability to make predictions and conjectures. Students explore the...
Curated OER
Study of Chance
Seventh graders determine the fairness of various games. In this determining the fairness of various games lesson, 7th graders use spinners, dice, and rock,paper, scissors to play various chance games. Students determine if...
Curated OER
Box-and-Whisker
Seventh graders are introduced to the concept of box-and-whisker plots. A step-by-step process for creating a box-and-whisker plot is provided. The goal of the instructional activity is that students study the components of a...
Alabama Learning Exchange
What's Your Favorite Chocolate Bar?
Learners complete a math survey. In this math graphs activity, students complete a survey about their favorite candy bars. Learners create different kinds of graphs using Microsoft Excel to show their results.
Curated OER
"M&M's"® Candies Worksheet 2
In this math worksheet, students plot the mean, median, and mode for the colors of M and M candies by filling in the graphic organizer.
Curated OER
Facing Life's Challenges
Students analyze divination and carry out experiments using a probability model. In this probability lesson plan, students review information about divination and predictions in various cultures. Students set up experiments to test...
Curated OER
Justifying Answers
Students demonstrate how to solve word problems. In this problem solving lesson plan, students use strategies such as drawing pictures, using counters, and making a table to justify how they solved the word problem.
Curated OER
Graphing With Paper and Computers
Fourth graders construct bar graphs. In this graphing lesson, 4th graders create bar graphs in connection with the story, The Copycat Fish. After creating the initial graphs on paper, students use MS Excel to create graphs.
Curated OER
Exploring Probability
Fifth graders work in small groups of five or six to conduct a series of investigations. While recording the results using pencils on individual tally worksheets rotating to different stations and comparing results with the other...
Curated OER
Probably Pistachio
First graders practice making logical predictions from information they are given.
Curated OER
Probability of a Boy
Students investigate the concept of even change by participating in a coin flip activity. They research using the Internet to investigate the chance of giving birth to a boy.
Curated OER
Data Analysis, Probability, and Discrete Math: Lesson 5
Eighth graders are read the material that is printed in boldface type inside the boxes. Information in regular type inside the boxes and all information outside the boxes should not be read to them. They then find the mean, median,...
Curated OER
Data Analysis & Probability
High schoolers make predictions based on survey results. They calcuate sample proportions. Students estimate the number of voters in their district preferring the democratic candidate using their sample results. They review sample...
Other popular searches
- Probablity Math Lessons
- Probability Math Lessons
- Math Lessons Probabilities
- Math Lessons/ Probability
- Math Lessons on Probability


