American Statistical Association
What Fits?
The bounce of a golf ball changes the result in golf, mini golf—and a great math activity. Scholars graph the height of golf ball bounces before finding a line of best fit. They analyze their own data and the results of others to better...
Curated OER
Range, Mode, and Median
Fifth and sixth graders sort data from least to greatest and mark an X on the line plot to show how many of each number. Then they determine the range, mode, and median for the problem.
EngageNY
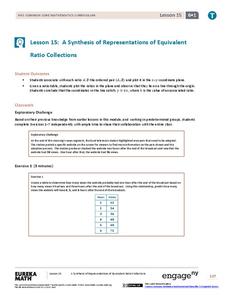
A Synthesis of Representations of Equivalent Ratio Collections
Make all the ratio representations fit together. The 15th segment in a series of 29 presents ratio problems to solve. Scholars use a variety of representations to respond to the questions. The problem set has pupils show how the...
Illustrative Mathematics
Puzzle Times
Give your mathematicians this set of data and have them create a dot plot, then find mean and median. They are asked to question the values of the mean and median and decide why they are not equal. Have learners write their answers or...
Shodor Education Foundation
Data Flyer
Fit functions to data by using an interactive app. Individuals plot a scatter plot and then fit lines of best fit and regression curves to the data. The use of an app gives learners the opportunity to try out different functions to see...
American Statistical Association
You and Michael
Investigate the relationship between height and arm span. Young statisticians measure the heights and arm spans of each class member and create a scatter plot using the data. They draw a line of best fit and use its slope to explain the...
Statistics Education Web
Consuming Cola
Caffeine affects your heart rate — or does it? Learners study experimental design while conducting their own experiment. They collect heart rate data after drinking a caffeinated beverage, create a box plot, and draw conclusions....
EngageNY
Choosing a Model
There's a function for that! Scholars examine real-world situations to determine which type of function would best model the data in the 23rd installment of a 35-part module. It involves considering the nature of the data in addition to...
Curated OER
Ordering Stories
What happened first? Learners examine four sets of images to sequence events using ordinal numbers. There is an example to get them started, and the first two have three pictures to organize. The final story is more challenging with four...
EngageNY
Tides, Sound Waves, and Stock Markets
Help pupils see the world through the eyes of a mathematician. As they examine tide patterns, sound waves, and stock market patterns using trigonometric functions, learners create scatter plots and write best-fit functions.
West Contra Costa Unified School District
Sneaking Up on Slope
Pupils determine the pattern in collinear points in order to determine the next point in a sequence. Using the definition of slope, they practice using the slope formula, and finish the activity with three different ways to...
Curated OER
Walk-A-Thon
Students graph linear http://www.lessonplanet.com/review?id=180542equations. In this problem solving lesson, students calculate slope and plot ordered pairs on a coordinate grid. Using a real-life example of a walk-a-thon, students...
Project Maths
Introduction to Patterns
The world is full of patterns. Help learners quantify those patterns with mathematical representations. The first Algebra lesson in a compilation of four uses a series of activities to build the concept of patterns using multiple...
Mathed Up!
Scatter Graphs
Make an estimate by getting in line. The class works with scatter plots and lines of best fit to make an estimate for given values. Pupils determine whether there is a positive or negative correlation and draw a best-fit line. Using the...
Curated OER
Plot and Name Points on a Grid
In this graphing worksheet, students solve a set of 6 problems, using a given graph to answer questions related to plotting points, units moved in a given directions and coordinates.
Curated OER
Graphing Coordinates
Sixth graders practice graphing coordinates. In this geometry lesson, they use the x and y axis to locate points that must be connected in the right sequence to form a straight line.
Curated OER
Introduction to functions
In this functions worksheet, students plot points on a graph according to the rule. Students plot 7 points on each of the 2 graphs given to them.
Curated OER
Funerals and Burial Rites
Ninth graders research burial practices that originated in West Africa and then migrated to the South Carolina and Ohio. They compare and contrast burial practices in both places. As students collect information and data, they organize...
Curated OER
Gridlock Jr.
In this gridlock worksheet, students roll dice and put counters in the ordered pairs on the graph that they get from the rolled dice. Students play this game and whoever gets 3 in a row wins.
Curated OER
Coordinate Plotting: Shapes
In this math worksheet, students graph ordered pairs on a coordinate grid. They connect the points to create a geometric shape. This worksheet generator allows teachers to select the size of the grid, the complexity of the shapes, and if...
Curated OER
Exploring Graphs
Students are introduced to connecting graphing in a coordinate plane to making scatterplots on a graphing calculator. Working in pairs, they connect points plotted to make a sailboat and complete questions on a worksheet as well as plot...
Curated OER
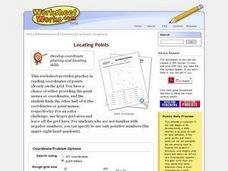
Locating Points
In this math worksheet, students write the coordinates of points that have been plotted on a coordinate plane. This worksheet generator allows teachers to select the size of the grid and whether or not to use negative coordinates. An...
Curated OER
Plotting the Ocean Floor
Fourth graders plot points on a graph, connect the dots to make the ocean floor profile and label the topographical features. They utilize a worksheet and a website imbedded in this plan to plot the ocean floor.
Curated OER
Graphing and the Coordinate Plane
Students gain practice reading coordinates and plotting points by participating in the Coordinates! Game. They demonstrate and test their skills with graph paper and the Maze Game.


