Curated OER
Line of Best Fit
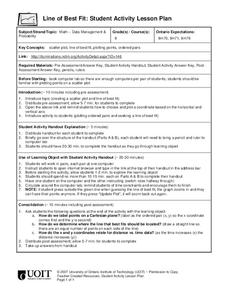
Students calculate the equation of the line of best fit. In this statistics instructional activity, students create scatter plots and find the line of best fit going through their data. They make predictions and draw conclusions.
Curated OER
Linear Functions
In this linear function worksheet, 6th graders solve and complete 3 various types of problems. First, they write the equation of a straight line that passes through a pair of points. Then, students complete each table by filling in the...
Curated OER
Handy Reflections
Learners explore reflections on a coordinate plane in this activity. They trace their hand on a grid, determine the coordinates of each point, and create a scatter plot of their points. Pupils use this information to investigate aspect...
Curated OER
Reading Graphs
Middle schoolers practice plotting functions on the Cartesian coordinate plane, see several categories of functions, including lines and parabolas, and read a graph, answering questions about the situation described by the graph
Curated OER
Reading Graphs
Students plot functions on the Cartesian coordinate plane. They explore lines and parabolas. Students analyze graphs and answer questions about the information presented on the graph using an online program.
Curated OER
Coordinate Plane Treasure Hunt
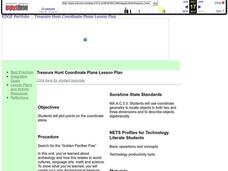
Middle schoolers create a treasure map by plotting points on a coordinate plane using a computer drawing program. Students name and identify different landmasses and structures on their map. They create instructions to find the...
Curated OER
Creating Line Graphs
High schoolers draw line graphs. In this math lesson, students interpret minimum wage data and graph the data in a line graph. High schoolers predict the next minimum wage and figure the earnings for a 40 hour work week for someone...
Curated OER
Fractal Fern
Students identify the location of coordinate pairs of an image. In this geometry lesson, students perform transformation and identify the image and pre-image point of location. They apply the concept of fractals to...
Curated OER
Cartesian Coordinate System
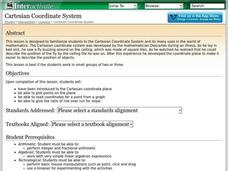
Middle schoolers explore the concept of the coordinate plane. In this coordinate plane lesson, students graph points on the coordinate plane using an applet. Middle schoolers graph functions using an applet. Students play a Maze Game...
Curated OER
Distance Formula
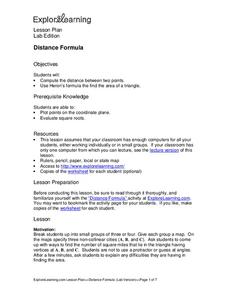
Pupils create ways to find the number of square miles that lie in a triangle having vertices at A, B, and C. They compute the distance between two points and use Heron's formula to find the area of the triangle. Finally, students...
Curated OER
Number Line Worksheet
In this math worksheet, students examine 5 portions of number lines between 20 and 50. Only a few intervals are marked with number labels. Students answer 5 questions about the number lines and the points plotted on them.
Texas Instruments
Circle Equations
Students explore the coordinate plane. In this secondary mathematics lesson, students follow a set of directions to plot points in the coordinate plane.
Mathematics Vision Project
Quadratic Equations
Through a variety of physical and theoretical situations, learners are led through the development of some of the deepest concepts in high school mathematics. Complex numbers, the fundamental theorem of algebra and rational exponents...
Sri Atmananda Memorial School
Rising Water
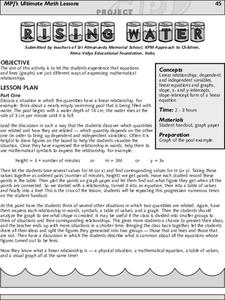
An engaging, and not to mention attractive, lesson plan has prealgebra and beginning algebra scholars examining linear relationships. They consider the rising water level as a swimming pool is being filled. They do so by charting and...
EngageNY
Arithmetic and Geometric Sequences
Arithmetic and geometric sequences are linear and geometric patterns. Help pupils understand the relationship and see the connection with an activity that asks them to write the rules and classify the patterns correctly. A sorting...
Curated OER
Spaghetti Bridges: Student Worksheet
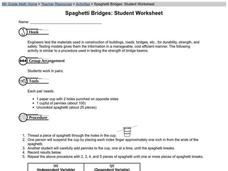
Pairs of learners work together in order to simulate how engineers test materials for strength and safety in the real world. They use paper cups and pieces of spaghetti to run strength tests. This excellent worksheet should lead to...
Curated OER
Linear and Exponential Functions
This comprehensive unit on linear and exponential functions provides numerous clearly-written worksheets. Topics include graphing linear equations, solving systems of equations algebraically and by graphing, identifying the domain and...
Illustrative Mathematics
Comparing Speeds in Graphs and Equations
Compare two different proportional relationships on a graph. It is up to your mathematicians to determine which of two moving objects have greater speed. A good example of a Common Core multiple choice question.
EngageNY
Linear Transformations Applied to Cubes
What do you get when you combine a matrix and a cube? Well that depends on the matrix! Pupils use online software to graph various transformations of a cube. Ultimately, they are able to describe the matrix that is responsible for a...
Curated OER
Review Graphing Parabolas & Circles
Students review how to graph parabolas. They practice graphing two different parabolas using the vertex and table method. They solve problems related to graphing circles, determining the radius and the center.
Curated OER
Which is Closer to 1?
A seemingly simple question that reveals a lot about a student's understanding of fractions. In finding an answer, learners compare fractions with different denominators that are both greater and less than one. No number line is...
EngageNY
Graphs of Exponential Functions
What does an exponential pattern look like in real life? After viewing a video of the population growth of bacteria, learners use the real-life scenario to collect data and graph the result. Their conclusion should be a new type of...
Curated OER
Slope-Intercept Form of a Line
Using the subscriber website Explorelearning.com, young mathematicians observe changes in the slope and y-intercept and their effect on the graph of lines. This activity helps middle schoolers develop an intuitive sense of the connection...
West Contra Costa Unified School District
Exploring Quadratics and Graphs
Young mathematicians first graph a series of quadratic equations, and then investigate how various parts of the equation change the graph of the function in a predictable way.
