Curated OER
Worksheet 1, Coordinate Graphing
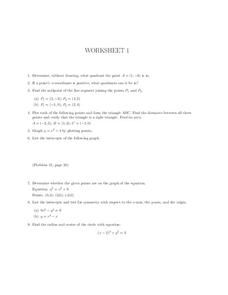
In this algebra worksheet, students determine the quadrant a given point is in. They find the midpoints of two line segments. Students plot points to form a triangle and find the distance between points. Students find the area of the...
Curated OER
Identifying Points in the Coordinate Plane
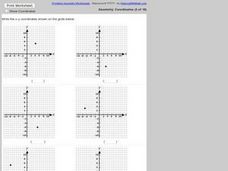
In this ordered pairs worksheet, learners identify 6 ordered pairs given a coordinate plane. Students list the ordered pair given the graph.
Curated OER
Graphing To Solve Systems of Equations
Students explore graping linear equations and their relevance to real life situations. After a teacher led demonstration, students work at their desks and on the board to plot points and determine the slope of a line. Students then...
Curated OER
Coordinate Grid Paper
In this coordinate grid worksheet, students plot point on the grid. Sheet is a blank template only with no specific associated activities. A website reference for additional resources is provided.
Curated OER
Coordinate Grid Paper
In this coordinate grid worksheet, students are given a blank coordinate grid graph on which to plot points. Page is a blank template with no specific associated activities.
Curated OER
Logistic Growth
Through the exploration of population growth of a bacteria population, high schoolers learn about and observe bacteria population over a 20 hour period. Students graph the population growth using a scatter plot and discuss its...
Math Mammoth
Functions in Coordinate Grid 1
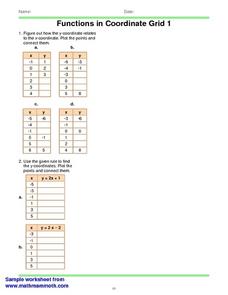
In this math worksheet, learners are given 4 tables of x-y coordinates and a grid. Students figure the relationship between the x and y coordinate and plot the points. Learners then use a given rule to find the y coordinate.
Curated OER
Curve Fitting
Pupils investigate linear, quadratic, and exponential regressions. They plot sets of data points, determine the regression equation that best fits the data and lastly investigate the coefficient of determination.
Curated OER
Tight Rope
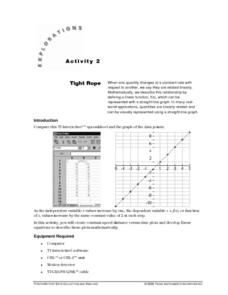
Learn how to explore the concept of linear functions. In this linear functions lesson, high schoolers collect linear data from a motion detector. Students walk to create a linear function. High schoolers plot the points...
Curated OER
Cartesian Geometry
In this geometry learning exercise, students plot coordinate pairs and connect the points to create different shapes. They give th shapes its polygon's name. They differentiate between simple functions and rectangular hyperbola.
Curated OER
Coordinate Plane
Tenth graders draw, label, plot and locate points on a coordinate plane. For this geometry lesson, 10th graders define a coordinate plane and identify the different quadrants. They relate coordinate plane to the game of battleship as...
Curated OER
Review of Linear Graphing
Students graph linear equations. In this algebra lesson, students create tables from an equation and plot their points. They graph the equation using the slope and y-intercept. They rewrite word problems using linear equations to...
Curated OER
When the Snow is as High as an Elephant
High schoolers study the concept of mean values using a data plot. Learners enter the given data in the activity to create their data table. They use the data table to calculate the mean of the snowfall percentage provided in the...
Curated OER
Writing Equations from a Table
Students use coordinates in a table to write equations. In this algebra lesson plan, students discuss rate of change as it relates to slope and x and y values. They plot the points from a table to graph their lines and write an equation...
Curated OER
The Distance and Midpoint Formula
For this college level mathematics worksheet, students solve use the Pythagorean Theorem to find the missing side of a right triangle and explore the connection between the Pythagorean Theorem and the distance formula....
Curated OER
Multivariable Optimization
In this multivariable optimization worksheet, students determine the local maximum and local minimum of given functions. They identify the critical points for given function and match contour plots to the proper functions. This four page...
Inside Mathematics
Graphs (2006)
When told to describe a line, do your pupils list its color, length, and which side is high or low? Use a worksheet that engages scholars to properly label line graphs. It then requests two applied reasoning answers.
Curated OER
MAP Practice
In this geometry activity, students create circle, line and bar graphs using different comparisons of events. There are 24 questions with an answer key.
Curated OER
Volcanoes: Sixth Grade Lesson Plans and Activities
Bring a set of pre-lab, lab, and post-lab lesson plans on volcanoes to your earth science unit. Sixth graders explore the three types of volcanoes found on Earth, plot the specific locations of these volcanoes on a map, and...
Curated OER
Where am I Located
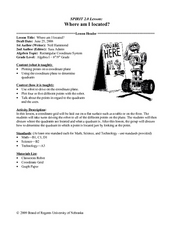
Students calculate and find a certain location. In this geometry lesson, students examine a coordinate plane for pair of coordinates. They calculate the distance between point using the distance formula and estimation.
Curated OER
Introduction to Slope Fields
Students plot slope fields. In this introduction to slope fields lesson, students plot 12 slope fields for given differential equations.
Curated OER
Lesson 10-5: Transformations
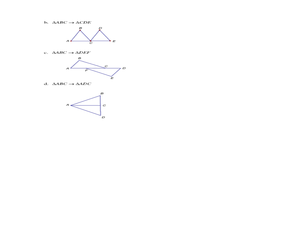
In this transformations learning exercise, students solve 5 multi-part short answer problems. Students transform images by reflecting them over a line or a point. Students find the line and/or point symmetry of various figures.
Curated OER
Robot Cartography
Students identify points plotted on the coordinate plane. In this geometry lesson, students learn to read a map using concepts of a coordinate plane grid. They find the path given a map to tell them where to go.
Curated OER
Straight Line Graphs
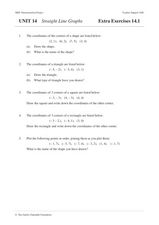
In this math instructional activity, students plot lines on a graph paper when given the equation for the line in slope-intercept form. They tell the values of the slope and the y-intercept. Students find the x and y intercepts and plot...
