Curated OER
Slope of a Line
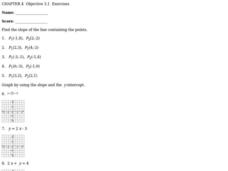
In this slope of a line worksheet, students solve ten problems determining the slope of points and an equation. First, they find the slope of the line containing the two points given in the first five problems. Then, students graph the...
Curated OER
First-Quadrant Grids
In this math worksheet, students analyze six first-quadrant grids. Students may use the grids for a variety of math activities, including plotting points.
Curated OER
Coordinate Grid
In this math worksheet, students plot points on a coordinate grid. The grid ranges from positive ten on the x-axis to positive ten on the y-axis.
Curated OER
Melissa's Garden
In this math activity, students identify the location of pictures on a coordinate plane. They write some answers as an ordered pair. They read ordered pairs and identify the picture at a specified location. Six problems are on a page. An...
Curated OER
Graph Paper
Students are given pre-made graph paper. In this algebra lesson, students are given copies of graph paper that can be used to plot points on a coordinate plane already measured out.
Curated OER
Comparing and Ordering Integers
Students compare and order integers on an umber line. In this algebra lesson, students differentiate between positive and negative numbers. They plot point in the correct order on a number line.
Curated OER
Graphing on a Coordinate Grid
Learners work in groups to create a graph on a coordinate grid. In this graphing lesson plan, students analyze data and put it into their graph by plotting points.
Curated OER
Straight Line Graphs
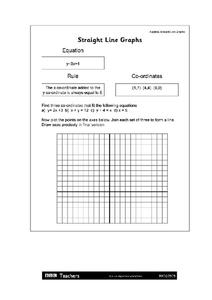
In this straight line graph worksheet, students identify linear equations. They plot points of given problems. This one-page worksheet contains 3 problems.
Noyce Foundation
Snail Pace
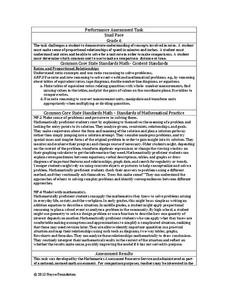
Slow and steady wins the race? In the assessment task, scholars calculate the rates at which different snails travel in order to find the fastest snail. Hopefully, your class will move much more quickly in finishing the task!
Curated OER
Marine Animals: Stranded on the Coast
Students identify marine animals that could become stranded due to coastal features and currents. They plot data on worksheets for locations of sea turtles actually beached or stranded. After plotting their points, they hypothesize...
EngageNY
Summarizing Deviations from the Mean
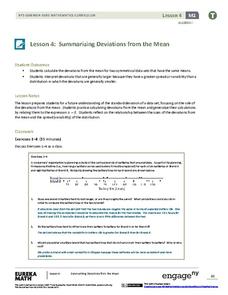
Through a series of problems, learners determine the variability of a data set by looking at the deviations from the mean. Estimating means of larger data sets presented in histograms and providing a way to calculate an...
EngageNY
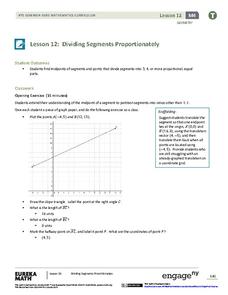
Dividing Segments Proportionately
Fractions, ratios, and proportions: what do they have to do with segments? Scholars discover the midpoint formula through coordinate geometry. Next, they expand on the formula to apply it to dividing the segment into different...
Illustrative Mathematics
Paying the Rent
Learning how a bank account works is a useful tool. The exercise in the resource is to deduct rent from a checking account and create an equation from a description. Participants then graph the balance of the bank account versus months...
Yummy Math
Deflate-gate
Does temperature affect the air pressure of a football? Young mathematicians look at the readings from a pressure gauge and determine if the balls are within regulation or are under inflated.
Shodor Education Foundation
Plop It!
Build upon and stack up data to get the complete picture. Using the applet, pupils build bar graphs. As the bar graph builds, the interactive graphically displays the mean, median, and mode. Learners finish by exploring the changes in...
Curated OER
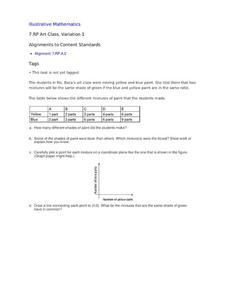
Art Class, Variation 1
Student statisticians calculate ratios to determine how many shades of green were mixed by Ms. Baca's art class. They graph the number of blue parts against the number of yellow parts for each combination and discover that some produce...
Thomson Brooks-Core
Complex Numbers
A straightforward approach to teaching complex numbers, this lesson addresses the concepts of complex numbers, polar coordinates, Euler's formula, De moivres Theorem, and more. It includes a practice problems set with odd answers...
Shodor Education Foundation
Multi-Function Data Flyer
Explore different types of functions using an interactive lesson. Learners enter functions and view the accompanying graphs. They can choose to show key features or adjust the scale of the graph.
Illustrative Mathematics
Why Does SSS Work?
While it may seem incredibly obvious to the geometry student that congruent sides make congruent triangles, the proving of this by definition actually takes a bit of work. This exercise steps the class through this kind of proof by...
Balanced Assessment
A Sharper Image
Not all continuous functions are differentiable. Pupils find three types of functions that are defined everywhere but not differentiable for all values of x. Along with providing examples of each type of function, learners...
Curated OER
Plotting Amish Farmland
Second graders listen to the book, Down Buttermilk Lane by Barbara Mitchell. They discover how to read a grid and then together as a class, plot 2 squares, one yellow and one green. Then they plot the remaining squares independently and...
Curated OER
Graphing Points Worksheet
In this graphing points worksheet, learners plot ordered pairs on a coordinate plane. They graph 20 given problems, with 10 problems requiring students to graph two or more points.
Alabama Learning Exchange
The State Capital of Stem and Leaf
Students explore the concept of stem and leaf plots. In this stem and leaf plots lesson, students plot the 50 US states' capitals on a stem and leaf plot according to the first letter of each state. Students compare...
Curated OER
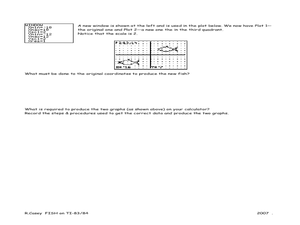
Fishing for Points TI-83/83 Plus
Ninth graders investigate the Cartesian coordinate plane. In this Algebra I lesson, 9th graders explore the coordinates of a drawing of a fish and examine the effects of moving the drawing on the ordered pairs. Students predict the...
