Curated OER
My Test Book: Stem and Leaf Plots
For this math skills worksheet, students solve 10 multiple choice math problems regarding stem and leaf plots. Students may view the correct answers.
Curated OER
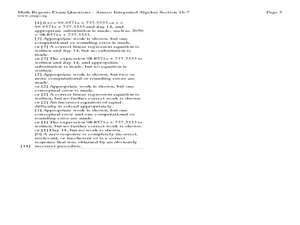
Fourteen Math Regent Exam Statistics Questions on Scatter Plots and Linear Regression
For this linear regression worksheet, students solve fourteen Math Regent Exam questions regarding scatter plots and linear regression. The solutions are provided.
Curated OER
Graphing Points: Pre Test
In this graphing points worksheet, students complete multiple choice questions about axis's on a graph and points on a graph. Students complete 10 questions total.
Curated OER
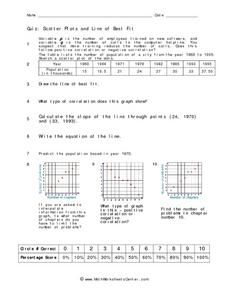
Quiz: Scatter Plots and Line of Best Fit
In this scatter plots and line of best fit worksheet, students create scatter plots from given sets of data. They answer questions concerning the scatter plot. Students write the equation of a line, identify the type of correlation...
Curated OER
Graphing Points: Post Test
In this graphing points worksheet, students answer multiple choice questions about the points on a given graph. Students answer 10 questions total.
Curated OER
Formulas
In this algebra worksheet, students plot points in order to find the slope, midpoint, or distance between two points. There are 16 questions.
Curated OER
Coordinate Plane
Tenth graders plot points on a coordinate plane. In this geometry lesson, 10th graders identify the different quadrants, plots points on a number line and coordinate plane and solve for the midpoint of line segments.
Curated OER
Graphing From Function Tables
In this graphing from function tables worksheet, learners graph given functions from a completed function table. This is a worksheet generator, the teacher can set the grid size for plotting points as well as whether or not to include a...
Curated OER
Graphing Greenery
Students gather leaves and trace them on graph paper. They plot coordinates that approximate the shape of the leaves and share those coordinates as "worksheets" for other students to complete.
Curated OER
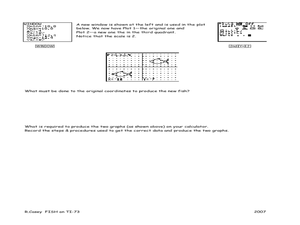
Fishing for Points
Learners explore the concept of ordered pairs. In this ordered pairs instructional activity, pupils list the ordered pairs of a graph in the shape of a fish. They use their calculator to translate the fish using lists, then translate the...
Curated OER
Interpreting and Displaying Sets of Data
Learners explore the concept of interpreting data. In this interpreting data lesson, students make a line plot of themselves according to the number of cubes they can hold in their hand. Learners create their own data to graph and...
Georgia Department of Education
The Basketball Star
Have learners use math to prove they are sports stars! Assess a pupil's ability to create and analyze data using a variety of graphs. The class will be motivated by the association of math and basketball data.
Curated OER
Discovering PI
In this pi learning exercise, students identify and complete 4 different problems that include pi and graphing data points. First, they complete the chart at the top by measuring the diameter and circumference of each object. Then,...
Curated OER
The Way to Better Grades!
Pupils collect and analyze data. In this statistics lesson, learners create a scatter plot from their collected data. They use, tables and graphs to analyze the data and mae decisions.
Alabama Learning Exchange
I Know What You Did Last Summer: A Data Graphing Project
Young scholars participate in graphing data. In this graphing data lesson, students make a stem and leaf plot of their summer activities. Young scholars create numerous graphs on poster boards. Students discuss the...
Curated OER
Fire!, Probability, and Chaos
Upper elementary and middle schoolers work with the concept of probability. They are introduced to the concept of chaos. Learners graph and analyze using a line plot, work with mean, and are introduced to the concept of variance.
CCSS Math Activities
Scatter Diagram
Don't let a great resource scatter to the winds. Pupils analyze two sets of test scores on a scatter plot. They draw a line of best fit and use it to make predictions about the test scores. They also consider any apparent trends in the...
Curated OER
Points in a Complex Plane -- Lecture
Middle schoolers review plotting points on a coordinate plane. Individually, they add and subtrace complex numbers and graph them in a complex plane. They follow along a worksheet while their teacher lectures on the new material and...
Curated OER
Simultaneous Equations for Circuit Analysis
In this worksheet, students use Algebra to plot different solutions to equations and analyze schematics in order to answer a series of 25 open-ended questions about electrical circuits. This worksheet is printable and the answers are...
Curated OER
Estimating the Mean State Area
Seventh grade statisticians randomly select five states and then determine the mean area. The class then works together to create a dot plot of their results.
Curated OER
Walking the Plank
This is a cool math activity. Kids collect and interpret data based on a physical act. A board is balanced between a scale and a step, learners record a peer's weight as it decreases while s/he walks further away from the scale. They...
Curated OER
The Coordinate Plane
Use this Saxon math coordinate plane instructional activity to have your learners utilize a graphing calculator, equate the vertices of a rectangle, and then graph their conclusions as well as answer a variety of fill in the blank...
EngageNY
Describing the Center of a Distribution Using the Median
Find the point that splits the data. The lesson presents to scholars the definition of the median through a teacher-led discussion. The pupils use data lists and dot plots to determine the median in sets with even and odd number of data...
EngageNY
Symmetry in the Coordinate Plane
The 17th installment of a 21-part module investigates symmetry in the coordinate plane. After plotting several examples, scholars develop a rule for the coordinates of a point after reflecting over the x-axis, the y-axis, or both.


