Shodor Education Foundation
Measures
Take a look at data from a statistical lens. An interactive allows pupils to enter data set, labeling the data including the units used. Manipulating the applet, learners select the statistics to calculate that include total, mean,...
Shodor Education Foundation
Stem and Leaf Plotter
The key is in the leaves. Pupils enter data to create a stem-and-leaf plot. The resource then displays the plot and calculates the mean, median, and mode of the data. Using the plot and the calculated measures of spread, learners analyze...
Curated OER
Measurement Worksheet
In this interactive measurement learning exercise, students arrange the six groups of objects according to their height.
Shodor Education Foundation
Pythagorean Explorer
Make sure the measurement is right. The interactive provides right triangles with a missing side measurement. Pupils use the given sides and the Pythagorean Theorem to calculate the length of the missing side. After entering the length,...
Shodor Education Foundation
Plop It!
Build upon and stack up data to get the complete picture. Using the applet, pupils build bar graphs. As the bar graph builds, the interactive graphically displays the mean, median, and mode. Learners finish by exploring the changes in...
Shodor Education Foundation
Squaring the Triangle
Teach budding mathematicians how to square a triangle with an interactive that shows a graphical proof of the Pythagorean Theorem. Pupils alter the lengths of the legs using sliders. Using the inputted lengths, the applet displays the...
Shodor Education Foundation
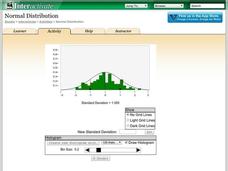
Normal Distribution
Does the size of the bin matter? The resource allows pupils to explore the relationship between the normal curve and histograms. Learners view histograms compared to a normal curve with a set standard deviation. Using the interactive,...


