Curated OER
Integration: Statistics, Measures of Central Tendency
Learners find the mean, median, and mode for each of four data sets. They are given two line plots, and compute the median and mode of the shown data. They find the median and mode for three stem and leaf plots. They solve two word...
Curated OER
Scatter Plots
In this scatter plots worksheet, students solve and complete 4 different problems. First, they use the table shown to model the relation with a scatter plot and trend line and to predict the value of a variable when given the other...
Curated OER
Ordering Stories
What happened first? Learners examine four sets of images to sequence events using ordinal numbers. There is an example to get them started, and the first two have three pictures to organize. The final story is more challenging with four...
Curated OER
Graphing and Analyzing
In this graphing and analyzing worksheet, 9th graders first state if each graph represents a linear or nonlinear relationship. Second, they create a difference table for each set of data presented and determine whether it represents a...
Curated OER
Using Matrices for Data
In this matrices for data worksheet, 9th graders solve and complete 29 various types of problems that include using matrices to illustrate data. First, they determine the sum, difference and scalar product for each matrices shown. Then,...
Curated OER
Graph Picture (Coordinate Pairs)
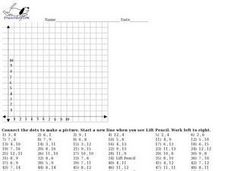
Coordinate graphing on a grid is the focus of this worksheet. Young mathematicians plot 42 coordinate pairs on a graphing grid, then connect the dots to make a picture. A fun way to get your learners involved in graphing!
Curated OER
Graph Picture (Coordinate Pairs) 2
Looking for an engaging way to encourage your class to practice graphing coordinate pairs? This might be the activity you are looking for! For this worksheet, learners create a picture by plotting 54 coordinate pairs on graph and then...
Curated OER
Graph Picture (Coordinate Pairs) 3
Here is a very good coordinate graphing worksheet. Learners practice graphing by plotting 58 coordinate pairs, then connecting the dots to reveal a picture. This resource could be used as an in-class activity or a homework assignment.
Curated OER
Graph a Picture on Cartesian Coordinates
Find out what picture is hidden in this graph and work on coordinate graphing with this worksheet! Learners plot 66 ordered pair points on a Cartesian graph, then connect the dots to make a picture. This would work as an in-class...
Curated OER
Least Squares
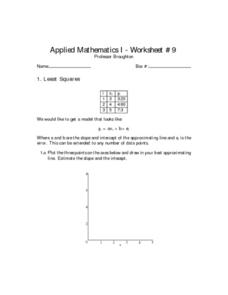
For this least squares worksheet, students solve 6 different problems that include the least squares of numbers. First, they plot 3 points on the axes shown and draw in their best approximating line. Then, students estimate the slope and...
Curated OER
Twenty-Seven Graphing Lines, Parabolas, and Absolute Value Problems
Have learners find coordinates of point on a graph, find equations of graphs given, and graph given equations using in and out tables. There are 27 problems related to equations for lines, parabolas, and absolute value functions.
Curated OER
Graphing
In this graphing instructional activity, students solve and graph 10 different problems that include determining various coordinates and the slope. First, they use the table to write the x and y coordinates for each point on the graphs....
Curated OER
Statistics
In this statistics worksheet, 9th graders solve and complete 5 different word problems that include different data. First, they determine if there is an explanatory and a response variable in the given data set. Then, students create a...
Curated OER
Parallels and Distance
In this parallels and distance worksheet, 10th graders solve 8 problems related to parallels of lines and the distance between each line. First, they draw the segment that represents the distance indicated in each figure. Then, students...
Curated OER
Problem-Solving Decisions: Choose the Operation
In this problem solving activity, students read a story problem about the temperature at different altitudes. Students fill out an organization chart to understand the problem, plan a strategy, and then solve it.
K12 Reader
Points on a Coordinate Grid
Introduce your class to the basics of coordinate planes. The reading passage included here describes ordered pairs and the different quadrants on a coordinate grid. Learners read the passage and respond to five related questions.
Curated OER
Rate Distortion
In this rate distortion activity, students solve 4 different sets of problems that include defining the rate distortion curve in various situations. They construct a rate distortion curve by plotting and angle against a particular line...


