Curated OER
You Scratch my Back, I'll Scratch Yours
Students explore the concept of interdependence. In this integrated interdependence lesson, students interpret graphs and charts that require them to analyze the relationship between Mexico and the United States. Students also...
Curated OER
How Do They Relate? Linear Relationship
Students collect information and use a line to represent it. In this algebra activity, students investigate real world data to see if it makes a line. They graph the line comparing the relationship of the x axis with that of...
Curated OER
Between The Extremes
Students analyze graphs for specific properties. In this algebra lesson, students solve equations and graph using the TI calculator. They find the different changes that occur in each graph,including maximum and minimum.
Curated OER
La Toteca- A Tropical Paradise
Students collect data on the time of the ferry. In this algebra instructional activity, students use the data to predict a ferry schedule. They also compute the depth where oxygen would be needed when diving.
Curated OER
Regressive Music
Student use the Ti calculator to graph sinusoidal graphs. In this calculus activity, students use the CBL to collect and analyze data of sinusoidal graphs. They manipulate their collected data and make predictions.
Curated OER
Linking Algebra to Temperature
Learners convert between two units as they calculate the temperature. In this algebra lesson, students collect data on seasonal climate and create a graph. They make conjectures based on their data collection.
Curated OER
Relating Distance and Velocity Over Time
Students calculate the distance and velocity over time. In this algebra lesson, students graph a linear function to represent the distance vers time travel. They interpret their graphs and draw conclusion.
Curated OER
The Twelve Days of Christmas
Pupils purchase gift items and practice collecting, analyzing, computing, and recording information. In this data lesson plan, students also complete money equivalent activities.
Curated OER
"Heat Transfer and Ice Cream!"
Learners analyze earth science by creating a frozen treat in class. In this heat transfer activity, students discuss how matter is transformed from solid to liquid and liquid to gas when energy is removed from the equation. Learners...
Curated OER
How Alike Are We?
Fourth graders find the range, mode, median, and mean for each of the data sets (height and shoe size). They discuss which measure of central tendency for each data set best represents the class and why. Students graph the shoe size and...
Curated OER
Detective Digis and the Computer Caper
Mathematicians participate in an hands-on activity to investigate the binary number system and write messages in binary code and have classmates decipher the messages. A said video on the topic does not seem to be available, but the...
Curated OER
Box Plots
Young statisticians are introduced to box plots and quartiles. They use an activity and discussion with supplemental exercises to help them explore how data can be graphically represented.
Curated OER
Fire!, Probability, and Chaos
Upper elementary and middle schoolers work with the concept of probability. They are introduced to the concept of chaos. Learners graph and analyze using a line plot, work with mean, and are introduced to the concept of variance.
Curated OER
Old Glory
Students utilize mathematical concepts such as: measurement, ratio and proportion and geometric probability to analyze the components of the U.S. Flag. They collect, organize and interpret data by constructing charts, tables and graphs...
Living Rainforest
Finding the Rainforests
From Brazil to Indonesia, young scientists investigate the geography and climate of the world's tropical rain forests with this collection of worksheets.
Curated OER
Code Breakers
Students collect data and make a frequency table, change ratios into percents, and analyze data to make predictions.
Curated OER
Distribution of children living at home
High schoolers examine census data to evaluate the number of students of certain ages living at home. This data is then used to determine the need for day care, or other social programs. They use this information to explore social policies.
Curated OER
Line Best Fit
Students identify the line of best fit. In this statistics lesson, students analyze graphs and plots to identify positive, negative or no correlation. They find the line of best fit for different scatter plots.
Curated OER
Rolling For Value
Students participate in a lesson to comprehend the concept of probability while rolling dice. They recognize patterns while making observations and recording the data for each roll. Students also review place values while playing a game...
Curated OER
Making Graphs
Students explore statistics by conducting class demographic surveys. In this graph making instructional activity, students identify the family members of each classmate, pets they own, and favorite activities. Students organize their...
Curated OER
What is Probability?
Students participate in a variety of activities in order to understand the concept of probability. The students are engaged because of the application of The Multiple Intelligences Theory.
Curated OER
The Estimation Station
Students challenge "common knowledge" against newly learned estimation strategies and put those strategies into use. They consider variables in estimating different groups of objects and practice skills of representing numbers.
Curated OER
Hispanic Heritage Month Lessons
Celebrate Hispanic Heritage Month by learning about history, culture, art, food, and civil rights.
Curated OER
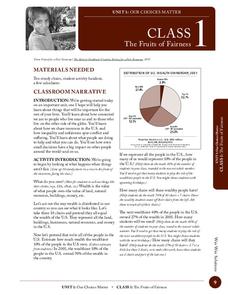
The Fruits of Fairness
Students examine the distribution of wealth in the US. In this economic distribution lesson, students use math skills to apply real statistics to the students in their classroom making these facts more of a reality.


