Curated OER
Position and Time Graphs
A series of graphs are displayed with points plotted for time and position. A question is asked for each, requiring your class to view one axis and track its partner coordinate. A few examples are given to begin each section, and so this...
Portland
State
University
Historical Reflections on the Fundamental Theorem Of (Integral) Calculus
Highlight the process of mathematical discovery for your classes. This lesson examines the development of the Fundamental Theorem of Calculus over time. Understanding the history of the theorem helps create a better understanding of the...
BW Walch
Creating Linear Equations in One Variable
The example of two travelers meeting somewhere along the road has been a stereotypical joke about algebra as long as algebra has existed. Here in this detailed presentation, this old trope gets a careful and approachable treatment....
BW Walch
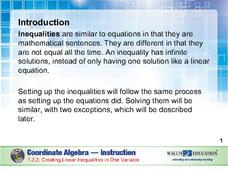
Creating Linear Inequalities in One Variable
Just when a young mathematician starts to feel comfortable turning word problems into linear equations, shake things up and throw inequalities in the mix. This excellent, instructive presentation takes the steps for solving an...
Teach Engineering
Coordinates and the Cartesian Plane
The plot thickens to get a functional understanding. After a short review of plotting points on the coordinate plane, class members learn the difference between functions and relations in the second lesson in a series of nine. They...
Annenberg Foundation
Skeeters Are Overrunning the World
Skeeters are used to model linear and exponential population growth in a wonderfully organized lesson plan including teachers' and students' notes, an assignment, graphs, tables, and equations. Filled with constant deep-reaching...
Curated OER
What is Motion?
Prior to beginning a math or physical science lesson on motion, use this presentation to define the concepts of motion, rate, velocity, and speed. This resource lacks concrete examples but could be useful as discussion starter.
Teach Engineering
Solar Power
How much solar energy is available at my location? An engaging resource provides a presentation along with script to give the class background information on determining solar radiation. Pupils then work through a worksheet to...
Mabry MS Blog
Scatter Plots
Scatter plots are a fun way to gather and collect relevant data. The presentation goes through several examples and then describes the different types of correlation.
Curated OER
Identifying Terms, Factors, and Coefficients
What are terms, factors, and coefficients? This slideshow provides definitions and examples of various parts of algebraic expressions, and provides guided practice problems in writing and identifying parts of algebraic expressions for...
Curated OER
The Colon
An outstanding presentation clarifies one of the most misunderstood and misused punctuation marks: the colon. With clear instructions about the appropriate times to use the colon and examples of proper usage,...
Teach Engineering
Show Me the Money
Class members learn how to estimate the total costs involved to design and build a bridge by including design, material, equipment, and labor costs. The activity includes a discussion about the trade-off between cost and aesthetics.
Curated OER
Intersecting Graphs
Ninth graders know how to solve a system of linear equations, but what happens when the system involves an exponential function? The instructional slideshow teaches viewers to determine solutions to systems of equations with linear...


