Curated OER
Oceans of Fun
Here is a great hands-on activity that should lead to a greater understanding of salt water, why the ocean is salty, and how ocean waves are formed. This terrific, old-school lesson has clearly described activities, and all of the...
Curated OER
Understanding Oceans
Students investigate how ocean currents affect our world. For this ocean currents lesson, students perform an experiment to show how cold water is near the poles and warm water is near the equator. Students use water, food coloring,...
Curated OER
How Oceans Affect Climate
Students draw conclusions about how the ocean affects temperature. In this weather lesson plan, students use the Internet to gather data to help them come to a conclusion about how the climate in a certain region is directly affected by...
Curated OER
Rain On
Fourth graders study the water cycle and clouds. In this water cycle and cloud lesson, 4th graders determine the definition of condensation and watch a demonstration in which the teacher makes a cloud in a bottle. They discuss the water...
Curated OER
Ocean Exploration: Shapes and Patterns Under the Sea
So many shapes in our vast oceans. Young explorers can discover new shapes in a variety of ways in this lesson. One way is having free exploration with a pattern shape kit handed out by the teacher. Another is by viewing a...
Curated OER
Explore the Ocean
Students explore the oceans from their origin. In this oceans lesson, students read and discuss excerpts from the Book of Genesis regarding the creation of the ocean. Students then clean up a mock oil spill, measure the volume and area...
Illustrative Mathematics
Mile High
What is the meaning of sea level? This resource helps your class understand the meaning of elevations above, below, and at sea level. Provides for good discussion on using positive and negative numbers to represent quantities in the real...
Curated OER
Long Day?
Students become aware of the effects of tides on the Earth's rotation. In this tides instructional activity, students calculate the number of seconds lost over various periods of time.
Curated OER
Right Place, Right Time
In this right place, right time instructional activity, students read train timetables and apply the information to answer math word problems. Students solve eight word problems.
Curated OER
American Journeys: Right Place, Right Time
Sixth graders measure distances on a map using string and a ruler. They complete mathematical word problems about measurement.
Curated OER
Interpreting Oceans of Data
Sixth graders analyze the data from a scientific experiment. In this statistics lesson, 6th graders answer questions about some data to show their understanding of the data. They apply the result to future decisions when using data.
Curated OER
Exploring The Depths!
Fifth graders make a model of the ocean floor. In this ocean characteristics lesson, 5th graders complete a KWL chart about the ocean floor, use the Ocean Depth Data Sheet to create a graph, and create a 3-D model of the ocean floor.
Curated OER
Perimeter and Circumference
Young scholars consider perimeter and circumference. In this lesson on perimeter, students will determine relationships between perimeter and circumference using real life examples.
Curated OER
Area
Young scholars solve problems involving area. In this geometry lesson, students calculate the area of an object and relate it to the area of the ocean. They define what exactly and area is and then solve problems relating to the real world.
Curated OER
Ocean Life: A Heavy Subject
Second graders examine The Learning Page Fact Files about ocean life and categorize the data by weight and group. They distinguish between fish, mammals, and invertebrates and which weigh the most and the least. Students record their...
Curated OER
Let's Get Physical
Explore the benefits of physical activity and how it will affect your students' health. Students track their physical activities for one week and then compare their results. Collaboration with a math teacher woould be useful as it...
Curated OER
Plotting the Ocean Floor
Fourth graders plot points on a graph, connect the dots to make the ocean floor profile and label the topographical features. They utilize a worksheet and a website imbedded in this plan to plot the ocean floor.
Curated OER
High and Low Tides
Students collect real world data from the Web regarding high and low tides at various locations in the United States. They find a function which models this data and make predictions on tide levels based on the information found.
Curated OER
How much is Dirt Worth?
Students problem solve to understand the value of the Earth's soil. In this value of dirt lesson, students understand how much of Earth is made of dirt and how important to our survival it is.
Curated OER
Scatter Plots
Seventh graders investigate how to make and set up a scatter plot. In this statistics lesson, 7th graders collect data and plot it. They analyze their data and discuss their results.
Curated OER
Sea Ice Board Game
Students understand the sea ice cycle and can explain its stages. In this Sea Ice lesson, students play a game to identify types of sea ice. Students answer critical thinking questions about sea ice. Students complete a sea ice worksheet.
Curated OER
Composition of Ocean Water
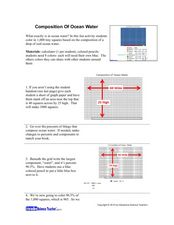
Learners experiment to determine the composition of ocean water. In this ocean water composition lesson, students color in a grid that shows the percentage of each of the components of ocean water which include chloride, sodium, sulfate,...
Curated OER
Float the Boat
Students collect data and analyze it using a graph. In this algebra lesson plan, students identify different bodies of water and relate the flowing to math. They collect data on the rate of flow and the height of flow. They analyze the...
Curated OER
Clam Hooping
Students explore ocean biology by capturing organisms on a beach. In this clam collecting lesson plan, students identify the clam species and discuss the anatomy of a clam as well as the importance they provide as a meal. Students...


