Curated OER
You Are What You Eat (High School)
Students evaluate data from a statistical chart or graph which they find in a newspaper or magazine.
Curated OER
Use a Graph
In this math graphs worksheet, students use the data within the 'Make-Believe Animals' bar graph to answer the six word problems. Students learn to read the graph and use the numbers to solve the problems.
Curated OER
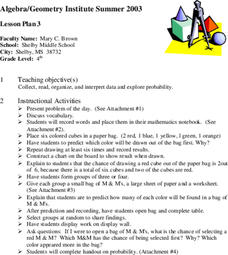
Exploring Probability
Fourth graders participate in a lesson that explores probability. They use candy and model cubes to experiment with different outcomes that can be charted if the students can proceed to the objective of the lesson. They discover how...
Curated OER
How To Identify Figurative Language
Pupils investigate writing techniques by analyzing a chart. In this figurative language lesson, students define similes, metaphors and identify the difference between them and personification. Pupils demonstrate their understanding by...
Curated OER
Energy Conservation (Middle, Mathematics)
Students take turns reading the electric meter six times a day at regularly scheduled intervals. They figure out the amount of electricity used and then determine the total cost of electricity for the week.
Curated OER
Ratios
Sixth graders pariticipate in a lesson that focuses on the finding of a ratio and using it to set up a proportion in realtionship to creating a scale drawing. This is done using given problems. It would be valuable for students to have...
Curated OER
Problem-Solving Strategies in Word Problems
Students examine how to determine which strategy to use to solve word problems. In this word problem strategy instructional activity, students listen to a lecture on the process of using different strategies to solve math problems. They...
Curated OER
Marking the Minutes
Students mark seconds, minutes, hours, days, etc. on class timetable report to keep track of time spent on Uninterrupted Silent Reading.
Curated OER
The Guise of a Graph Gumshoe
Eighth graders practice constructing bar, circle, and box-and-whisker graphs. They practice reading and interpreting data displays and explore how different displays of data can lead to different interpretations.
Curated OER
How Far Did It Travel?
Sixth graders read and discuss background and vocabulary. They use the background to develop a flow chart showing the movement of food from farm to table and work independently or in groups to complete an activity. They then use Internet...
Curated OER
Count The Letters
Young scholars perform activities involving ratios, proportions and percents. Given a newspaper article, groups of students count the number of letters in a given area. They use calculators and data collected to construct a pie chart...
Curated OER
Measuring Up on the Mayflower
Second graders use a meter tape to compare the length of the Mayflower to a basketball court and make homemade butter for crackers. Afterward, all students sit inside the makeshift Mayflower's dimensions and enjoy their Pilgrim butter.
Curated OER
Patchwork Quilting
Second graders use symmetry to create their own small quilt squares. They attach all of the squares to create a large class quilt.
Curated OER
Data Management and Probability: Applications
In this data management and probability applications worksheet, 8th graders solve 20 various types of probability problems. They find the mean, median, mode and range of various numbers. Then, students use the spinner illustration to...
Curated OER
Search for the Missing Pi
Third graders work in groups of two to three with measuring tapes, finding the circumference and diameter of teacher-selected circular items. They relate circumference and diameter measurements to find pi.
Curated OER
Graphing
Fifth graders create graphs based on climate in South Carolina. They read and interpret information in a chart and construct a graphy from the information in the chart. They create a spreadsheet using Excel and publish 2 graphs.
Curated OER
Metric Measurement
Students use, read and write with metric units. They practice converting from larger to smaller units. Afterwards, they construct a scale drawing of a bridge. In addition, they construct these two designs, using the same scale of 1cm to...
Curated OER
Sink or Float?
Students predict and explore to discover which objects sink or float in fresh and salt water, predict how salt affect objects, write predictions on T chart, discuss difference between man-made and natural waters, and graph results.
Curated OER
How Much Does a Bear Weigh?
Students estimate how many children in their class it would take to equal the mass of one adult bear. They then weigh and record their measurement on a chart to check their estimate.
Curated OER
Name Fame
First graders learn the uniqueness of their names by reading the book, Chrysanthemum, and completing other integrated math counting and graphing activities.
Curated OER
Cloud Watchers
Second graders read "The Cloud Book" by Tomie dePaola to jumpstart their cloud study. They offer examples of liquids, solids, and gases and chart them. They observe the making of a cloud in a demonstration. They discuss and draw...
Curated OER
Dollar Word
Students review the value of coins prior to adding up values to equal one dollar. Letters of the alphabet are assigned monetary values and students use calculators to add up the value of a word. Students work with a partner to try and...
Curated OER
Greenhouse Effect ...Building Our Own
Young scholars explore the greenhouse effect. They set up a simplified model of the earth and the greenhouse effect. Students compare temperatures inside a jar to temperatures outside the jar. Pupils collect information and create a line...
Curated OER
Best-Selling Books Bar Graph
Students fill in bar graphs to show ten of the best-selling students' books of all time. Students create simple bar graphs to show how many copies of each of the ten books have been sold.


