Federal Reserve Bank
Less Than Zero
Perry the penguin wants to buy a new scooter, but he doesn't have any funds! Walk your kids through the short book Less Than Zero, and have them track his borrowing, spending, and saving on a line graph while you read. Pupils will learn...
Curated OER
Graphing Names in Historic Cemetery
Students collect information from headstones about names of the deceased in their local community. They determine the most common names and graph them. They discuss their findings with the class.
Curated OER
Making Graphs
Young scholars explore statistics by conducting class demographic surveys. In this graph making lesson, students identify the family members of each classmate, pets they own, and favorite activities. Young scholars organize their...
Curated OER
Twelve Days of Christmas--Prediction, Estimation, Addition, Table and Chart
Scholars explore graphing. They will listen to and sing "The Twelve Days of Christmas" and estimate how many gifts were mentioned in the song. Then complete a data chart representing each gift given in the song. They also construct...
Miami University
Chapter Nine Worksheet: Monopoly
Advanced economics pupils analyze a series of graphs, data sets, and profit scenarios all related to monopolies and marginal revenue. They read through the background information, complete a graph using the data provided, and justify...
Yummy Math
US Holiday Candy Sales
Candy is a big business! Calculate the amount of money consumers spent on major holidays—Easter, Halloween, Christmas, Hanukkah, and Valentine's Day—based on the total amount of candy sales from 2011 and the percentage of each holiday's...
Curated OER
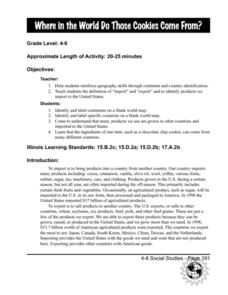
Where in the World Do Those Cookies Come From?
Pupils discuss exports and imports by discovering where the ingredients come from for making chocolate chip cookies. They take a survey of their favorite cookies and create a bar graph to represent the information.
Curated OER
Away We Go!
Students study types of transportation. In this transportation lesson, students survey several classes to gather data on how they get to school. Students create a transportation graph.
Curated OER
What Did It Cost 100 Years Ago?
Students compare prices of good across the century in order to introduce the topic of inflation. They undertand the concepts of inflation and Consumer Price Index (CPI), use online calculators to figure the approximate cost of goods...
Curated OER
Charting Historical Gas Prices
Students investigate the historical and current prices of a gallon of gasoline. Using an online tool, they calculate the inflation-adjusted cost of gasoline over the years, and create a graph to demonstrate the actual cost vs. the...
Curated OER
Aboriginal Statistics
Fourth graders analyze statistics of Native Americans by creating graphs. In this data analysis lesson, 4th graders define different statistical terms and practice finding those statistics from groups of numerical information about...
Curated OER
McCadam's Quarterly Report
Fourth graders problem solve a problem from a local business using data, generating graphs, and draw conclusions. They submit their findings in a business letter format with feed back from a company's plant manager.
Curated OER
Sunrise, Sunset: Quickly Go the Days
Students explore the concept of daylight. In this daylight lesson plan, students compare the amount of daylight on a particular day in Anchorage compared with daylight where they live. Students color maps of the US according to amount of...
Curated OER
Teenage Star Golfer
Students read a story called Teenage Golfer Already a Star and answer vocabulary and comprehension questions about it. In this current events teenage golf lesson plan students respond to literature by answering questions, recalling...
Curated OER
New to School Student Booklets
Students create a book about their school experience entitled, "(Student's name) Goes to School." They identify who their friends are and discuss and list them as one page in their booklets. Students also listen to a story read by the...
Education World
The African American Population in US History
How has the African American population changed over the years? Learners use charts, statistical data, and maps to see how populations in African American communities have changed since the 1860s. Activity modifications are included to...
Spectrum
Grade 5 Standardized Test Prep
Here you'll find a great sampling of practice standardized test questions organized into four sections: ELA, mathematics, social studies, and science. Help your learners become familiar with the types of multiple-choice questions...
Curated OER
Lessons for Atlatl Users with Some Experience-Grade 5
Fifth graders throw darts, collecting data for distance traveled. In this data analysis instructional activity, 5th graders throw a dart using an atlatl. They calculate the speed for each throw and determine the best dart length for...
Curated OER
How Far Did They Go?
Students create a map. In this direction and distance lesson, students come up with familiar places in the community and calculate the distances from these places to the school. Students create a map that displays these places and their...
Curated OER
Take Me Out To the Ball Game
Students use a map to graph and locate major league teams of different sports. In groups, they analyze the population data of the United States and compare it with the amount and location of the major league teams. They share their...
Curated OER
Let's Learn About Jobs
Students evaluate the jobs that their parents do. In this literature-based social studies lesson, the teacher introduces the concept of work both at home and on the job and leads the children in the creation of a Venn diagram to aid in...
Curated OER
Poverty & Disease: What is the Link?
Students consider how to reduce poverty and fight disease around the world. In this interdisciplinary lesson, students participate in activities regarding global poverty, fighting disease, and connections between poverty and disease.
Curated OER
2002 Memorabilia and Mascots
Students calculate costs and determine change in scenarios where they buy 2002 Olympic Winter Game memorabilia for themselves, family and friends.
Curated OER
Is There a Stone in My Soup?
Students plan a service project. In this service learning lesson, students demonstrate their understanding of philanthropy as they plan a stone soup party.


