Curated OER
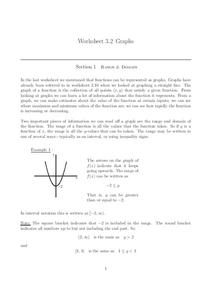
Graphs
In this graphs worksheet, students solve and complete 15 various types of problems. First, they determine the range of the function of the graph shown and write in interval notation. Then, students find the domain of the function in the...
Federal Reserve Bank
Less Than Zero
Perry the penguin wants to buy a new scooter, but he doesn't have any funds! Walk your kids through the short book Less Than Zero, and have them track his borrowing, spending, and saving on a line graph while you read. Pupils will learn...
Curated OER
Math--Pictures and Bars--Learning About Graphs
What is a graph? What does it tell us? How do you make one? These are all questions that are answered in the included packet. It's a great introduction to graphing for young learners!
Curated OER
Less and More Scavenger Hunt
Send your scholars on a measuring scavenger hunt with this interactive worksheet! They use a graphic organizer to record their findings as they search for items which are less than, more than, or just about one inch long. For each, they...
Curated OER
“My Little Sister Hugged An Ape” | Literature, Math, & More!
Students read the story "My Little Sister Hugged An Ape" and make a list of sensory words from the story. In this interdisciplinary math lesson, students participate in sensory writing, and complete a questionnaire which they will use to...
Curated OER
Making Graphs
Students explore statistics by conducting class demographic surveys. In this graph making lesson, students identify the family members of each classmate, pets they own, and favorite activities. Students organize their statistics and...
Curated OER
Twelve Days of Christmas--Prediction, Estimation, Addition, Table and Chart
Scholars explore graphing. They will listen to and sing "The Twelve Days of Christmas" and estimate how many gifts were mentioned in the song. Then complete a data chart representing each gift given in the song. They also construct...
Curated OER
Further Differentiation
In this further differentiation worksheet, students solve and complete 7 various types of problems. First, they sketch the graph of each equation using a stationary point. Then, students find the stationary points of each and describe...
Curated OER
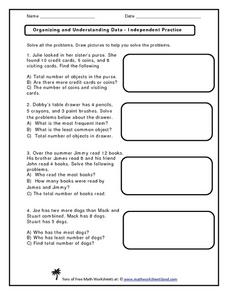
Organizing and Understanding Data - Independent Practice
Provide your first graders with an opportunity for independent practice organizing and understanding data. The ten story prompts on this three-page worksheet asks learners to solve problems involving concepts of the total number of...
Curated OER
Buying Cars/Financing Cars Compound Interest
Provide a real world context in which exponential functions are used to determine a eal world phenomena such as compound interest and exponential growth. This instructional activity should be taught after students have mastered the laws...
Pennsylvania Department of Education
Use Order of Operations to Evaluate Expressions—No Grouping Symbols
Students identify and explain different types of data collection and graphs. In this graphs and data collection lesson, students record their observations of a variety of data collection tools and graphs displayed in the room. Students...
Pennsylvania Department of Education
Equal Groups
Students explore statistics by completing a graphing activity. In this data analysis activity, students define a list of mathematical vocabulary terms before unpacking a box of raisins. Students utilize the raisins to plot data on a line...
Curated OER
Data Analysis
In this data analysis worksheet, learners solve and complete 6 different problems that include using various types of data analysis. First, they create a stem-and-leaf plot of the ratios shown at the top and determine the mean, median,...
Curated OER
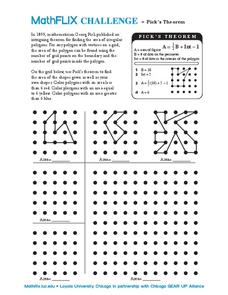
Pick's Theorem
In this Pick's Theorem instructional activity, students solve and graph 6 different problems that include using Pick's Theorem to solve. First, they use Pick's Theorem to determine the area of the shapes given as well as their own shapes...
Centers for Disease Control and Prevention
Major Disparities in Adult Cigarette Smoking Exist Among and Within Racial and Ethnic Groups
Data indicates that some racial groups smoke more than others, and that with that racial group, there are smaller groups whose smoking habits vary as well. Secondary learners read a graph that details the differences between the Asian...
Alabama Learning Exchange
The Grouchy Ladybug
Learners listen to the book, "The Grouchy Ladybug" by Eric Carle and sequence the events in the story. Using a graph, they draw and color the animals that the ladybug meets next to the corresponding time from the story, and conduct...
Curated OER
Coordinate Connections
Sixth graders complete several activities that involve coordinates and graph paper. They visualize and identify geometric shapes after applying transformations on a coordinate plane. Finally, 6th graders draw and label a coordinate...
Curated OER
Aboriginal Statistics
Fourth graders analyze statistics of Native Americans by creating graphs. In this data analysis instructional activity, 4th graders define different statistical terms and practice finding those statistics from groups of numerical...
Curated OER
Frog and Toad are Friends
Students view a 30-minute video lesson plan to discover information about the characteristics of frogs and toads. They then transform themselves into frogs and participate in a Jumping Frog Jubilee. They work in groups of three to...
Curated OER
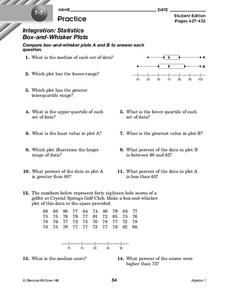
Box-and-Whisker Plots
In this box-and-whisker plots worksheet, 9th graders solve and complete 14 different problems that include comparing various box-and-whisker plots. First, they determine the median for each set of data and plot the lesser range. Then,...
Curated OER
Prime Numbers
In this prime numbers learning exercise, students read facts and complete comprehension activities. In this graph construction and drawing learning exercise, students complete two activities.
Curated OER
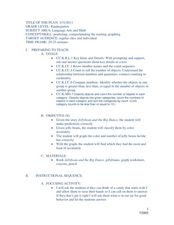
The Jellybeans and the Big Dance
Enchant your youngsters by reading them The Jellybeans and the Big Dance, by Laura Numeroff and Nate Evans. Ask them to name objects that begin with the letter J like jellybeans. Give each of them some jellybeans to sort by color....
The New York Times
Fiction or Nonfiction? Considering the Common Core's Emphasis on Informational Text
Nothing aids in comprehension more than an explanation and understanding of why things are done. Address why the Common Core requires the reading percentages that it established and analyze how this affects your readers. Learners read...
Curated OER
Which Bag is Which?
Students explore number sense by completing a statistical analysis game in class. In this data graphing lesson, students utilize visual references such as colored cubes and tiles to map out the results of an experiment outcome such as a...
