Wolfram Research
Wolfram Math World: Frequency Distribution
This site from MathWorld provides a general overview of frequency distribution, complete with a bar graph and explanatory text.
Math Is Fun
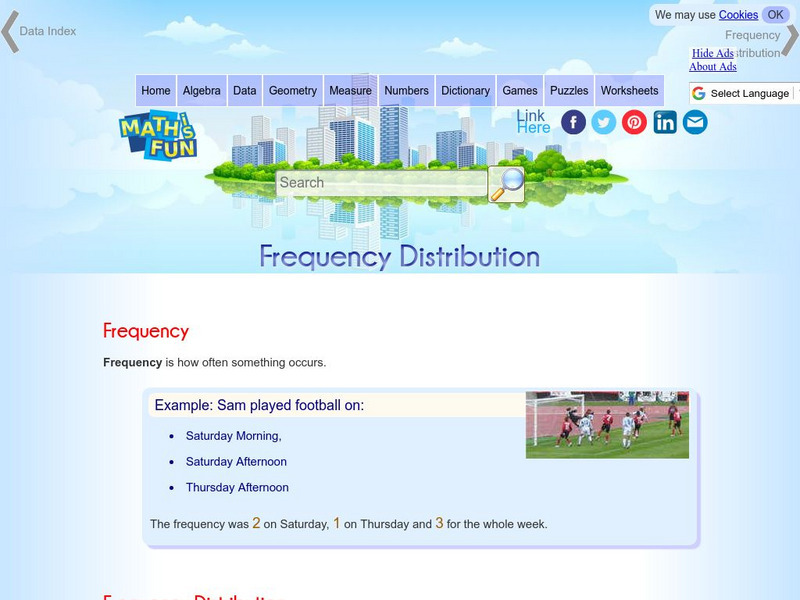
Math Is Fun: Frequency Distribution
Explains, with examples, what a frequency distribution table is. Includes a set of practice questions.
McGraw Hill
Glencoe Mathematics: Online Study Tool: Quiz on Frequency Distributions
Learners demonstrate comprehension of advanced mathematical concepts. The online quiz tests the students on frequency distributions.
McGraw Hill
Glencoe: Self Check Quizzes 1 Frequency Tables
Use Glencoe's randomly generated self-checking quiz to test your knowledge of frequency tables. Each question has a "Hint" link to help. Choose the correct answer for each problem. At the bottom of the page click the "Check It" button...
Khan Academy
Khan Academy: Two Way Relative Frequency Tables
Practice creating two-way relative frequency tables from a two-way frequency table. Students receive immediate feedback and have the opportunity to try questions repeatedly, watch a video, or receive hints.
Khan Academy
Khan Academy: Two Way Frequency Tables
Given a Venn diagram or information about a relationship, create a two-way frequency table. Students receive immediate feedback and have the opportunity to try questions repeatedly, watch a video, or receive hints.
Khan Academy
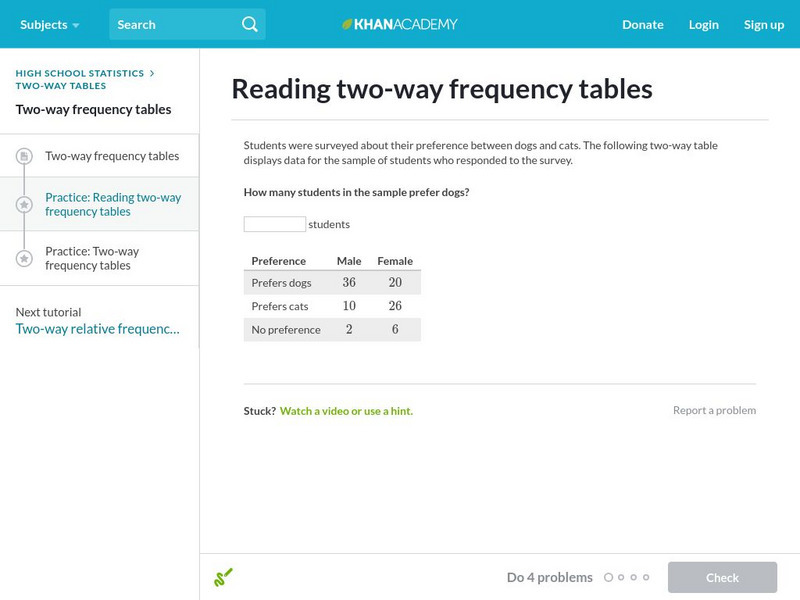
Khan Academy: Reading Two Way Frequency Tables
Practice interpreting two-way frequency tables. For example, what does the cell in the top left tell you? Students receive immediate feedback and have the opportunity to try questions repeatedly, watch a video, or receive hints.
Khan Academy
Khan Academy: Creating Frequency Tables
In this exercise, students practice creating frequency tables. Students receive immediate feedback and have the opportunity to get hints and try questions repeatedly.
Khan Academy
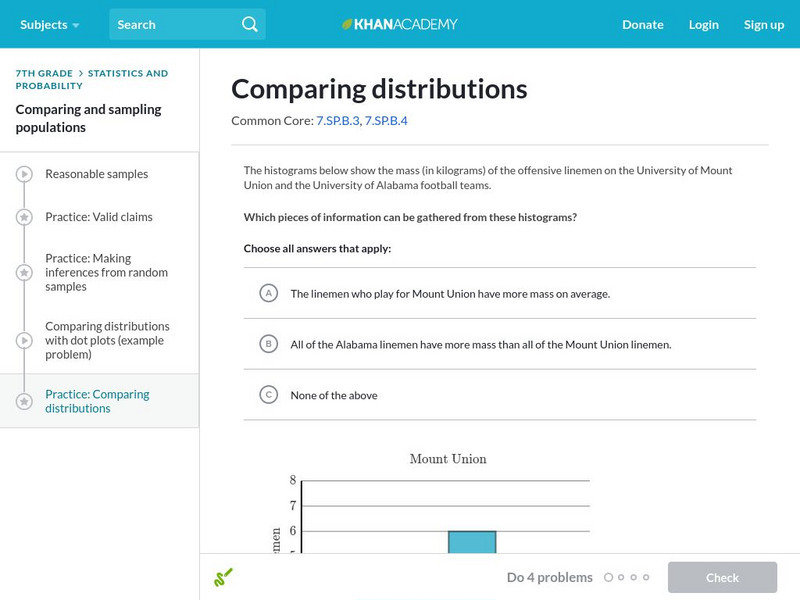
Khan Academy: Comparing Distributions
Try these practice problems comparing distributions.
Khan Academy
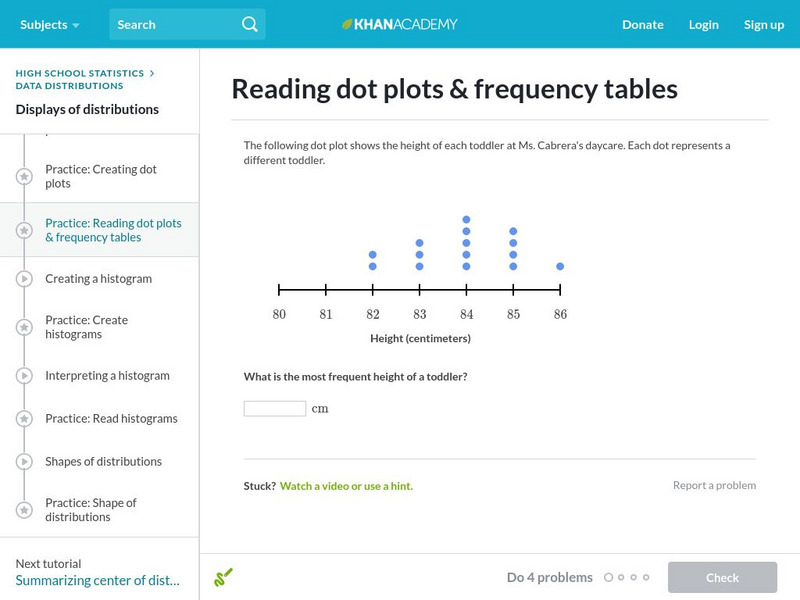
Khan Academy: Reading Dot Plots and Frequency Tables
In this exercise, students practice reading dot plots and frequency tables. Students receive immediate feedback and have the opportunity to get hints and try questions repeatedly.
Wolfram Research
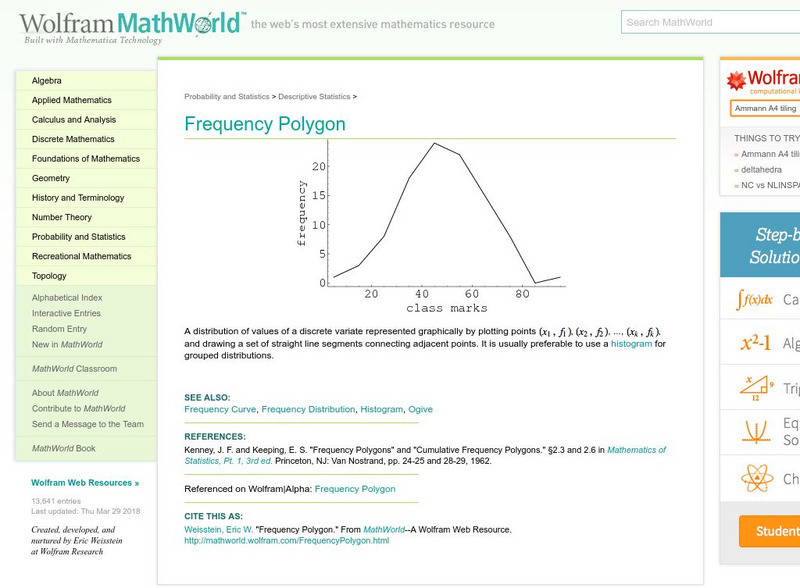
Wolfram Math World: Frequency Polygon
MathWorld provides a general overview of a frequency polygon, complete with a graphical example.
PBS
Pbs Learning Media: Restocking Shoes
In this video from Cyberchase, Bianca uses data on past shoe sales to help her decide what quantities of each size she should order in the next shipment.
Khan Academy
Khan Academy: Valid Claims
Practice figuring out whether we took a random sample and whether we're able to draw valid conclusions from our data. Students receive immediate feedback and have the opportunity to try questions repeatedly, watch a video or receive hints.
University of Illinois
University of Illinois: Rollin' Rollin' Rollin'
This page from the University of Illinois is the beginning of a series that demonstrates the difference between the mean and median of a group of numbers. The sites use bar graphs to display the data.
Khan Academy
Khan Academy: Creating Dot Plots
Practice creating dot plots. Dot plots are very similar to frequency tables, but they make it easier to see the data. Students receive immediate feedback and have the opportunity to try questions repeatedly, watch a video or receive hints.

