PBL Pathways
Doctors and Nurses
How many nurses does it take to support one doctor? A project-based activity asks learners to analyze state data to answer this question. Classes create polynomial functions from the data of doctors and nurses over a seven-year...
Mathematics Vision Project
Module 7: Connecting Algebra and Geometry
The coordinate plane links key geometry and algebra concepts in this approachable but rigorous unit. The class starts by developing the distance formula from the Pythagorean Theorem, then moves to applications of slope. Activities...
Curated OER
Collecting And Fitting Quadratic Data
Young scholars investigate the concept of using quadratic data to plot coordinates on a plane. They also apply the quadratic formula for a variety of problems with the help of a graphing calculator to draw the parabola for given...
Curated OER
Parent Functions Reference
In this functions worksheet, students explore the graphs of fifteen parent functions. This worksheet is meant as a reference for students.
Curated OER
Vertical and Horizontal Translations
Eleventh graders study seven functions. They use their handheld calculator to determine which family of functions the equation belongs, the parent function described, and they calculate the vertical and horizontal translation.
Curated OER
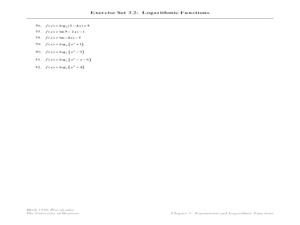
Exercise Set 3.2: Logarithmic Functions
In this logarithm worksheet, students solve 82 short answer problems. Students use log properties to simplify logarithms and natural logarithms.
Curated OER
The Lady's Age
Students use a game to establish the context of solving problems in a systematic and mathematical fashion. They also solve various types of equations to find reasonable solutions.
Curated OER
Weighing Time
Students devise a strategy to solve problems that is done in a systematic and mathematical fashion. The finding of the unknown value is the focus of the lesson. To solve linear equations proficiently is the skill of the lesson.
Curated OER
Slope & Rate of Change
This short handout addresses the concept of slope in two different ways: geometrically and analytically. Start with a brief description of slope, then use graphical representations to compare positive vs. negative slope and zero vs....
Curated OER
Solving Absolute Value Inequalities
Start this activity with a brief description of how to solve absolute value inequalities. A space is provided to help classify the inequalities into types (greater than, less than, or equal to) and for learners to show how to graph their...
Curated OER
Introduction to Graphical Representation of Data Sets in Connection to Cellular Growth
Students practice graphing relationships between variables by studying topics such as exponential growth and decay. They conduct a series of numerical experiments using a computer model and a variety of physical experiments using mold,...
Curated OER
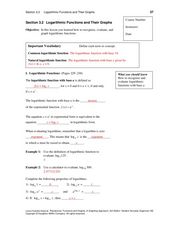
Logarithms and their Properties
In this logarithm worksheet, students explore the properties of logarithms. Explanations and examples are provided. This three-page worksheet contains ten logarithm problems to solve.
Curated OER
Logarithmic Functions
In this logarithms functions worksheet, students learn about logarithms and answer 13 questions pertaining to logarithms. This worksheet contains the link to a website with additional information.
Curated OER
Complex Analysis: Polar Form
In this polar form worksheet, students write complex numbers in polar form. They draw an Argand diagram containing vectors and draw sketches representing in a coordinate plane. This two-page worksheet contains thirteen multi-step...
Curated OER
Get a Half-life!
Students use m&m candies as their sample set. They begin by counting the total number of candies to determine their sample size. Students put the candies into a cup and shake them gently before pouring them onto a paper plate. Count...
Curated OER
Logarithmic Functions and Their Graphs
In this algebra worksheet, students evaluate, graph and solve logarithmic functions. They rewrite log functions and identify different log properties.
Curated OER
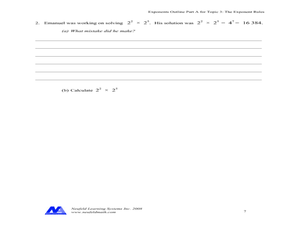
The Exponents Rules
In this exponent rules worksheet, students solve and complete 6 various types of problems. First, they complete the chart shown by first giving the question. Then, students expand the question and find the answer using the rules for...
Curated OER
Why Are Hot Things Red?
In this radiation and temperature worksheet, students use 2 methods to derive the Wein Displacement law that shows the relationship between the temperature of a body to the frequency where the Planck curve's value is at its maximum....
Curated OER
The Right Angle
In this algebra worksheet, 11th graders solve word problems creating a right triangle. Students determine the point and direction this turn of ninety degrees occurs. There are 4 questions with an answer key.
Curated OER
Evaluating Algebraic Expressions
In this Algebra I/Algebra II worksheet, students use substitution to evaluate algebraic expression, including absolute values, factorials, and exponents. The two page worksheet contains eighteen multiple choice...
Alabama Learning Exchange
I'm Lovin' It: Finding Area Between Curves
Students explore the concept of finding the area between two curves. In this finding the area between two curves instructional activity, students model the logos of McDonalds, Nike, and Motorola on grid paper. Students find functions to...
Curated OER
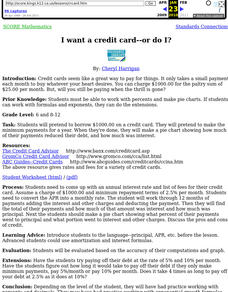
I want a credit card--or do I?
Students pretend to borrow $1000.00 on a credit card. They pretend to make the minimum payments for a year. When they're done, they make a pie chart showing how much of their payments reduced their debt, and how much was interest.
Curated OER
Precalculus Exam
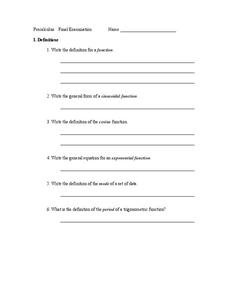
In this precalc lesson, students write out definitions, identify functions, solve integrals and derivatives and graph trig functions as they relate to angles. This is a final exam for precalculus. There are 80 questions on this exam.
Curated OER
Purchasing A Used Car
Seventh graders investigate the practice of purchasing a used car with the help of links and resources found in the lesson plan. They conduct research to find the right kind of car using a variety of resources. Students examine data in...


