Curated OER
Stem-and-Leaf Plots
Seventh graders study steam-and-leaf plots. Given specific data, they create a stem-and-leaf plot . Students identify the mean, mode, range and median. Afterward, they review vocabulary words.
Curated OER
Circle Graphs
Sixth graders participate in a lesson that covers the reading and interpretation of a circle graph. They review the part of a whole concept for percents and student observe and practice using the circle graph.
Curated OER
Flight Dreams - Flight Factors
Students investigate the physics of flight by experimenting in class. In this history of flight lesson, students define terms such as gravity, lift, and drag in order to better understand how a plane is able to stay in the air....
Curated OER
The Human Memory
This is a well-designed, creative lesson to help students learn more about the human memory. Working in pairs, students complete tasks and gather data. Excellent websites for resources are also provided.
Curated OER
Polygons, Parallelograms, Quadrilaterals- Oh My!!!
Learners demonstrate their comprehension of shapes and their properties. They work in small groups. Students review the following terms: property, polygon, quadrilateral, and parallelogram. They read Shape Up! Fun With Triangles and...
Curated OER
Hearing Handicap
Learners examine the effects of hearing loss. In this instructional activity on physical disabilities, students survey five older adults on hearing impairments. Learners pool their data and compare their results with the results from...
Curated OER
Graphing Statistics & Opinions About Pets
Students explore how to use a double bar graph by polling other students about their feelings and experiences with pets. They also have the opportunity to think about how pets affect their lives. Students poll their classmates to find...
Curated OER
Immigration and Citizenship
Students make graphs showing Canada's immigration patterns over time. Then students play the role of an immigrant seeking citizenship and perform a mock citizenship ceremony.
Curated OER
Visualizing the Aging Population
Young scholars examine the needs for products and services for the aging. In this entrepreneur lesson, students compare and contrast the age distribution of different countries and the needs of this population.
Curated OER
Subtraction (Single Digits)
First graders demonstrate subtraction process using an object (fish scales), set up a subtraction problem using fish scales, and apply the subtraction sign when separating sets of objects.
Curated OER
Chocolate Preferences Voting and Graphing Techniques
Students practice sampling and graphing techniques. In this data collection and interpretation lesson, students write and conduct surveys about chocolate preferences and then collect their data. Students graph the data in order to...
Curated OER
Trigonometric Identities
Students calculate the six trigonometric identities. In this algebra lesson, students verify other identities using the basic trigonometric identities of sine, cosine and tangent. They complete a worksheet with hints and then are graded...
Curated OER
Find Someone Who........
Fifth graders identify, describe, and classify lines, line segments, rays, and angles. When given a diagram of a line, they classify the line as perpendicular, parallel, intersecting, vertical, horizontal, and/or diagonal.
Curated OER
PASS-N-PRAISE
Fifth graders take turns explaining, orally and in writing, how to solve multiplication problems that contain no more than three digit by two-digit numbers.
Curated OER
Cost Effective Buying
Students complete a worksheet that asks them to calculate the true energy cost of various appliances. They compare appliances with energy saving features, rebates and other economical incentives.
Curated OER
POWER OF VOTING
Fifth graders explain the process of a national presidential election by researching through the Internet and holding an election simulation. They collect, graph, and interpret election data. They enhance their computer skills by...
Curated OER
The Farther Away You Are, The Faster Away You Move
Students explore linear relationships. The lesson uses science to develop an understanding of the expanding Universe. There are 3 Labs, only 2 of which are required. Lab C is an enrichment for higher level classes.
Curated OER
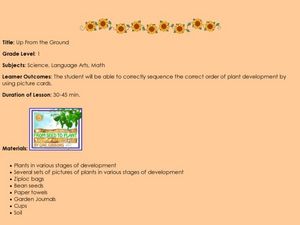
Up From the Ground
First graders sequence the development of a plant. In this plant life lesson, 1st graders listen to a story about how a plant grows, students view a PowerPoint presentation and learn new vocabulary. Finally, students sequence the stages...
Curated OER
Celebrate Black History
Students research African-American mathematicians. In this middle school mathematics instructional activity, students celebrate Black History by conducting Internet research on an African-American, mathematicians or...
Curated OER
Let's Measure the Speed of Sound
Third graders measure the speed of sound using scientific investigative techniques.
Curated OER
Chart the Stars
Seventh graders find constellation distances and plot the stars. In this star lesson, 7th graders plot the star points for Canis Major. Students use graphing calculators to graph the constellation. Students choose another constellation...
Curated OER
Designed to Scale
Seventh graders construct a three dimensional model of a constellation. In this constellation lesson, 7th graders make a blueprint for a scale model of the constellation and create their models. They present their models to the class.
Curated OER
Designed to Scale
Seventh graders study ratios, scale and distances according to a three dimensional model. In this exploratory instructional activity students create their own constellation and prepare an oral presentation that describes their...
Curated OER
La Toteca- A Tropical Paradise
Students collect data on the time of the ferry. In this algebra lesson, students use the data to predict a ferry schedule. They also compute the depth where oxygen would be needed when diving.

