Curated OER
Creating a Spreadsheet
Students create a spreadsheet using ICT. In this algebra lesson, students collect and graph their data using a spreadsheet. They find solution to a given problem using trial and error.
Curated OER
Probability
Students investigate probability. In this fourth through sixth grade mathematics instructional activity, students collect, organize and display data in an appropriate chart or graph as they calculate and apply basic probability.
Curated OER
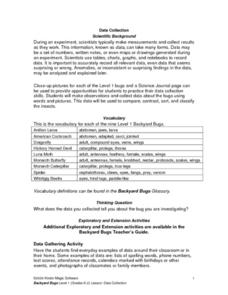
Science: Backyard Bugs Data Collection
Students practice data collection skills by observing common bugs found in their local environment. Once the data is collected they complete data sheets to compare, contrast, sort, and classify the insects. The instructional activity...
Curated OER
M&M Statistics
Students determine the difference between guessing and making a prediction. They discuss what they could graph using a bag of M&M's. They take a Raw data sample and convert it into a sample. They graph the actual results and combine...
Curated OER
Lake Pepperidge Farm
Students calculate proportions to determine the total population of Lake Pepperidge Farm. They collect a blind sample of fish and count the number of tagged and untagged fish. They collect data from all samples and record the data in a...
Curated OER
Tracks are for Trains
Second graders collect data on different forms of transportation and create a bar graph or pictograph with the information.
Curated OER
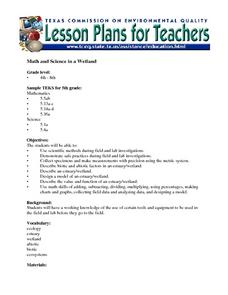
Math and Science in a Wetland
Students describe safe practice when doing field and lab investigations in a estuary or wetland. They create a model of an estuary and describe their value and function. They participate in field study in which they collect and analyze...
Curated OER
Dream Car Math
Students collect car cost comparison data from the "Car Wizard" web site to use as problem solving and for calculations related to math.
Curated OER
Graphing With Young Children: Math
Students create a template for a quality graph. They graph from scratch to match these criteria. They evaluate, in writing, the data represented in their newly created graph.
Curated OER
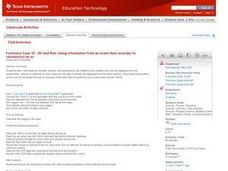
Hit and Run
Pupils explore data collection in this instructional activity. They investigate distance vs. time and velocity vs. time graphs using information collected with a CBR 2 to simulate the reconstruction of an accident.
Curated OER
Poetic Math Greeting Cards
Fourth graders work in groups; collect data in a survey; depict in tables, charts, or graphs the results of the survey; and make predictions. They use creative writing skills and computer skills to generate a greeting card of their own.
Curated OER
Analysis of Atmospheric Conditions for a High Mountain Retreat
Students examine the relationship between altitude, atmospheric pressure, temperature and humidity at a particular location. They practice science and math in real world applications. They write reports detailing their scientific...
Curated OER
Exponential Decay
Learners study exponential decay and its application to radiocarbon dating. In this exponential decay lesson, students use candy to model the time it takes for something to decay. Learners also graph the data they collect and...
Curated OER
Jelly Bean Math
Students estimate, measure, compute, and create patterns using jelly beans. In small groups, they solve various calculations, place jelly beans into groups, invent a new flavor, create a pattern, and complete a worksheet.
Curated OER
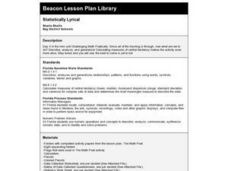
Statistically Lyrical
Students examine and discuss the writing of ratios as fractions and where they can be found in the real world. They complete worksheets and a questionnaire, and calculate the mean, median, and mode scores for the class.
Curated OER
Closing the Case
Fifth graders collect data and prepare data displays using a survey with statistical information.


