Curated OER
Sundials and Shadows - What Can They Teach Us About Seasons?
Students collect and analyze data relating to seasonal changes. They view a video, research web sites and build a sundial to collect their data.
Curated OER
Seasons and Cloud Cover, Are They Related?
Students use NASA satellite data to see cloud cover over Africa. In this seasons lesson students access data and import it into Excel.
Curated OER
Pumpkin Problems
Students participate in a lesson that has the intention of working on estimation skills. They use pumpkins to estimate the number of seeds are inside. They collect data for each pumpkin and compare it to the estimation. Students question...
Curated OER
And Now, the Weather...
Students collect and analyze data. In this middle school mathematics/science lesson, students collect temperature reading over a 24 hour period. Students analyze the data for mean, median, maximum and minimum.
Curated OER
Survey and Share
Young scholars practice collecting data by surveying other students. In this data collection lesson plan, young scholars decide on a question and collects data from 15 other students. Eventually the young scholars will end up graphing...
Curated OER
Graphing Data
Second graders examine how to make and read bar graphs. For this bar graph lesson, 2nd graders compare bar graphs to pictographs by looking at hair color survey data. They practice making a bar graph and finding the range of the data.
Curated OER
Interpreting Data-Working with Controls and Variables
Young scholars review the meaning of control and variables, and state difference between dependent and independent variables. They complete a worksheet with the definitions and complete problems that show their understanding.
Curated OER
Math Lesson: How Many People Live There?
High schoolers are able to calculate the population density of a country, and calculate the population density of large cities in that country. They are able to create an appropriate graph to represent their data for that country.
Curated OER
Bubbles
Third graders perform an experiment using different mixtures of dishwasher detergent. They construct bar graphs that record their bubble data for each detergent set.
Curated OER
Sorting Sweethearts
Learners categorize sweetheart candy by color or message. In this sorting and graphing lesson, students collect data by sorting the candy and then diagram their results in a graph.
Curated OER
How Do You Like Your Eggs?
First graders conduct a poll about how people like their eggs. In this graphing lesson, 1st graders collect data about how they like their eggs. Students use a picture of themselves to place under the type of egg they like. Students then...
Curated OER
Jack and the Beanstalk Math
Students listen to Jack and the Beanstalk and determine what they think are the most common words. In this Jack and the Beanstalk instructional activity, students reread the story, count the words they chosen and graph those words....
Curated OER
Creek Detectives WISE On-line Research Community
Students investigate ways people cause harm to the environment. In this environmental lesson, students explore a case study on the Internet. Students explore all of the online activities and collect data for a presentation.
Curated OER
Mean Median and Mode
Students collect data, graph it and analyze it. In this statistics instructional activity, students plot their data and calculate the mean, median and mode explaining how it relates to the data. They define the ways to find the mean,...
Curated OER
The Vitruvian Theory - Does It Apply to You?
Students explore the concept of the Vitruvian theory. In this Vitruvian theory lesson, students collect data from their classmates about their arm span and height. Students compare their ratios of arm span to height...
Curated OER
Livelihood of the Times
Students recognize the importance of analyzing historical information and data. In this historical analysis lesson, students collect information for a bar graph, complete a jobs worksheet and define vocabulary.
Curated OER
Making Paper
Students explore paper making. In this cross curriculum multicultural ecology and art lesson, students follow written and oral instructions to make paper using common household items. Students predict the amount of paper use in their...
Curated OER
Contaminated Drinking Water
Students predict, experiment, and draw conclusions about the safety of drinking water. In this ecology instructional activity, students participate in an experiment to determine if they can taste or see contamination in drinking water....
Curated OER
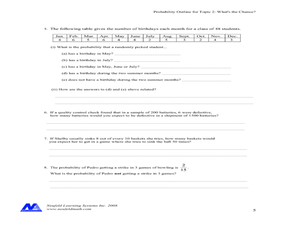
Concept: What's The Chance?
In this concept worksheet, students perform probability experiments. Using collected information, they interpret the data. Students answer questions about probability. This five-page worksheet contains approximately 15...
Curated OER
3 Kinds of Graphs
Students construct three different graphs-a line graph, a bar graph, and a circle graph. In this graphing lesson, students use different graphs to display various data that they collect.
Curated OER
West Nile Virus and Lyme Disease: Making Sense of the Numbers
In an interdisciplinary exploration, trace the development of West Nile fever and Lyme diseases. Pupils discover how these diseases are contracted. They collect statistical data and analyze trends.
Curated OER
Drip, Drip, Drip or The Case of the Leaky Faucet
Students explore the cost of wasted water. In this math lesson, students conduct an experiment in which they collect data on how much water is lost when a faucet leaks. Students figure the cost of the water that was wasted.
Curated OER
Using Diagrams in Problem Solutions
Students use tables, graphs and diagrams to collect data. For this problem solving with diagrams lesson plan, students construct their own tables and graphs containing information they gather from a drawing. They also make a Venn Diagram...
Curated OER
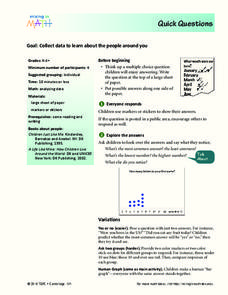
Quick Questions
Students ask their classmates survey questions. In this survey lesson, students come up with a question and possible answers. Their classmates mark their answers and the class discusses what they notice.


