Curated OER
TI Workshop Presentation Guide for "Preparing for Proofs"
Pupils discover proofs using the TI in this geometry lesson. They collect data from newspaper and magazines and analyze their data using the TI, relating it to proofs.
Curated OER
TI-Nspire Activity: What Does Your Representation Tell You?
By learning to select the best representation for three meal plans, students compare three meal plans to determine the best choice. Data for the meal plans is sorted on a table, as an algebraic equation, and graphed on a coordinate grid....
Curated OER
Geometric Sequences and Series
Learners find common ratios of geometric sequences on a spreadsheet. Using this data, they create scatter plots of the sequences to determine how each curve is related to the value of the common ratio. They will consider whether series...
Curated OER
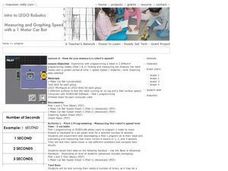
Introduction to Lego Robotics
Students utilize computer programs to operate a simple robot. In this technology lesson, students create robots using Lego pieces and simple motors to move them. Students measure the speed of the robots by running Robolab...
Curated OER
Applied Science - Built Environment Lab
Students evaluate trash. In this Science lesson, students collect and weigh trash from their classrooms. Students categorize the trash and the corresponding weights, recording the information on a data sheet.
Curated OER
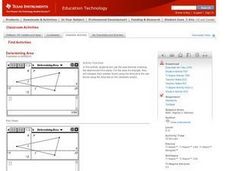
Determining Area
High schoolers conduct chemical experiments. In this chemistry lesson, they investigate reactions using the CBL system. Learners will graph and analyze their data using a TI.
Curated OER
Angles Formed By Parallel Lines
Young scholars explore the concept of angles formed by parallel lines.They graph two parallel lines cut by a transversal, then measure the angles formed by the transversal and record the data in a table. Learners make conjectures about...
Curated OER
Exploring the Exponential Function
Learners collect and analyze data regarding exponential functions of the form y = abx. Students explore the affects of changing parameters on the graph of the function.
Curated OER
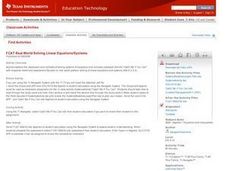
FCAT Real World Solving Linear Equations/Systems
Pupils relate real life situation to the equations, graphs and inequalities. They model real life scenarios using matrices and draw conclusions from their data. This lesson plan is aligned with FCAT.
Curated OER
Chill Out: How Hot Objects Cool
Teach how to explore exponential equations. In this Algebra II lesson, students investigate the graph that occurs as a hot liquid cools. Students model the data algebraically.
Curated OER
Popular Paper
Students explore the benefits of recycling paper. In this recycling lesson plan, students use statistics to calculate the amount of paper that is thrown away each week and construct a graph. Students analyze the data and calculate the...
Curated OER
Its OK To Be a Clod
Middle schoolers describe factors that affect the solubility of a chemical substance in seawater. In this sea environment lesson, student explain how information on the solubility of a substance can be used to measure water currents....
Curated OER
Basketball And Mathematics
Eighth graders collect and analyze data about foul shots taken at basketball games.
Curated OER
Introduction to Graphical Representation of Data Sets in Connection with Nuclear Decay
Students record data, make observations, and share in experimentation and discussion of numerical experiments.
Curated OER
What is the Value of the Car?
Students practice determining the value of cars. Using the internet, they complete a worksheet in which they list the make of each car and use the data to determine the value. They share their results with the class and identify the most...
Curated OER
Positive Future Fair Project
Ninth graders view the film "Pay It Forward" and discuss what kind of public campaign is needed to move people to positive action. They consider different ways of presenting information (graphs, visual displays, etc.) as tools for...
Curated OER
Let's Get Physical
Learners collect data using the CBL. In this statistics instructional activity, students predict the type of graph that will be created based on the type of activity the person does. The graph represents heart rate depending the level of...
Curated OER
Don't Lose Your Load!
Students create graphs using collected data. In this algebra lesson, students use spreadsheet in Excel to create graphs to interpret their data and make predictions. They rewrite word problems using algebraic expressions.
Curated OER
What Pie?
Students practice making and interpreting pie graphs so they are better able to decide if a pie chart is the appropriate form of display. Students examine included overheads of different pie charts, and directions on how to make pie...
Curated OER
Chucky Chickadee's Bird and Breakfast: Sing in Please
Students observe bird feeding and complete a tally and graphing activity for their observations. In this bird graphing instructional activity, students work in teams to observe bird feedings. Students complete a bird reporting sheet and...
Alabama Learning Exchange
What do Plants Need?
Students plant seeds and watch them sprout. Once growing plants are placed in different conditions and students record data about their growth. They graph the data.
Curated OER
Graphing With Paper and Computers
Fourth graders construct bar graphs. For this graphing lesson, 4th graders create bar graphs in connection with the story, The Copycat Fish. After creating the initial graphs on paper, students use MS Excel to create graphs.
Curated OER
Chicken Pox Math
Students will listen to a story of a boy with chicken pox and participate in a class discussion of chicken pox and what to do when you have a contagious disease. They will incorporate math by graphing who in the class has had the...
Curated OER
Discovering Ohm's Law
Connect math with science! Pupils apply properties of Ohms Law as they solve problems and identify the inverse relationship of a function. They analyze the shape of the graph of an inverse function and use it to make predictions.


