Curated OER
Model and Solve Algebraic Equations
Examine multiple ways to solve algebraic equations. Pupils will generate a problem solving strategy that addresses the prompt given by the teacher. They will then share their problem solving strategy with the class. Graphic organizers,...
Curated OER
What Are My Chances?
Students calculate probability. In this lesson on probability, students use given data to calculate to chances of a given event occurring. Many of the calculations in this lesson are applicable to daily life.
Curated OER
Reaction Time
Third graders review important vocabulary to explain measures of central tendency and reaction time. In pairs, they measure reaction time of dropping and catching a ruler. Data is collected after repeated catches and information is...
Curated OER
Leonardo da Vinci
Students select appropriate tools and technology to perform tests, collect data, and display data. They construct appropriate graphs from data and develop qualitative statements about the relationships between variables.
Curated OER
Bar Graphs
Third graders investigate bar graphs. In this third grade mathematics lesson, 3rd graders collect and analyze data and use the internet’s Graph challenge to create their own graphs. Students write questions for the other...
Curated OER
Measures of Central Tendency
Students analyze data using central tendencies. In this statistics lesson, students collect and analyze data using the mean, median and mode. They create a power point representing the different measures of central tendency.
Curated OER
Endocrine Disruptors in Our Drinking Water: Should We Be Concerned?
Students investigate the different hormone contaminants in the water supply. In this math lesson, students analyze data tables and graphs. They demonstrate exponential growth and decay using frog populations.
Curated OER
Cars on the Curve
Second graders, using two dice, participate in a car race game called Cars on the Curve. They predict which car wins the game and records it in their Data Diary.
Curated OER
Graphs
Students explore graphs and define the different ways they are used to display data. In this algebra instructional activity, students collect data and plot their data using the correct graph. They draw conclusions from their graphs based...
Curated OER
Box-and-Whisker Plots
Eighth graders measure in feet and inches and convert to explore the relationship between the converted measurements. In this measurement activity, 8th graders use the whisker and box plot to represent the measurement of a cat. ...
Curated OER
Weight Training
Students conduct a class-wide survey collecting, compiling, and analyzing data about fitness, weight loss, and body image issues. They analyze the relationship between exercise and diet in weight control.
Curated OER
Gravity, Angles, and Measurement
Students relate math to real life scenarios. In this geometry lesson, students launch a ball tracking each launch using a graph. They analyze their data for speed, angles and distance, trying to improve on each launch.
Curated OER
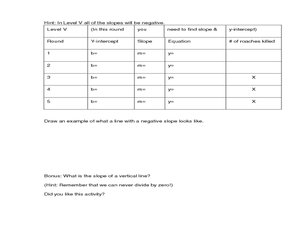
Cockroach Slope
Students identify the slope of linear functions. In this slope lesson, students collect data and graph it. They write equations with no more than two variables and use technology to explain their data.
Curated OER
Pick's Theorem
Students investigate polygons and their lattice. In this calculus lesson, students record data using different methods. They analyze their data and draw conclusions based on the relationship between the area and the interior lattice.
Curated OER
Opinions, Please!
Young scholars discuss the meaning and purposes of polls and surveys. After reading an article, they analyze the results of a poll given to residents of New York City. They create a survey of their own and analyze the data to write a...
Curated OER
How Long? How Wide?
Second graders distinguish between and use nonstandard and standard units of measurement, use appropriate tools and techniques to measure length and width, and record and interpret data using graphs.
Curated OER
Trajectory Perplexity
Students investigate measuring angles correctly through projectiles. In this geometry lesson, students launch a projectile to investigate the importance of how to measure an angle correctly and to explore trajectory. They collect...
Curated OER
Bar Graphs and Pie Charts
Young scholars graph data they collected and analyze it using a bar graph. For this algebra lesson, students analyze their data using pie charts and bar graphs while explaining the meaning to each other. They compare and contrast bar...
Curated OER
Exploring Diameter and Circumference
Learn how to identify the diameter and circumference of a circle. Then, collect data on a circle and relate it to the diameter and circumference of a circle. Last, plot data and find the line of best fit.
Curated OER
Fantasy Basketball
Learners play Fantasy Basketball in order to practice locating Internet information and using technology tools to display data; students demonstrate an understanding and use of graphing, probability, and statistics.
Curated OER
Graphing Pasta
Young scholars sort and graph various types of pasta. Using pasta construction paper patterns or real pasta, they sort the pasta by color, size, and type, and record the data on a graph.
Curated OER
Mean, Median, Mode and Range
Fourth graders investigate when to find the mean, median, mode and range. In this statistical concepts lesson, 4th graders collect data, make observations and graph the data. Students verify their work on the computer.
Curated OER
Lobster Roll!
Students collect data by playing a game that illustrates the delicate ecological balance between fishing, fishing regulations and fish populations. They graph and analyze the data and explain how economic decisions can affect the...
Curated OER
Counting Candies
Students count, sort, and classify jellybeans by color. They use their data to create a bar graph. Students are given a small bag of jellybeans, and a worksheet on Counting Candies Tally Chart. They work in small groups. Students are...


