Curated OER
Education for Global Peace
Fifth graders construct data graphs based upon sets of data. In this graphing lesson, 5th graders read the text If the World Were a Village and discuss how types of graphs accurately represent a large population. Students construct their...
Curated OER
"Colors" a poem by Shel Silverstein
Students collect data, graph it, and use the data to find measures of central tendencies, and find probabilities.
Curated OER
The Effect of Math Anxiety on Cardiovascular Homeostasis
High schoolers examine the effect stress due to test anxiety may have on the heart. As part of the experiment, students hypothesize, collect data, graph data, analyze data and formulate an understanding of their personal level of...
Curated OER
Ice Melting Investigation
Young scholars conduct an ice melting investigation in which they observe and measure the melting of two ice spheres. They develop a hypothesis as to which sphere will melt the fastest, collect data every ten minutes, and graph the data...
Curated OER
Mystery Graphs
Learners study graphs and learn how to display information into a graph. In this graph lesson plan, students construct a graph of their own sorted data, and pick out things in graphs that are inconsistent.
Curated OER
"The Outsiders" by S.E. Hinton
Students estimate the distance in miles between Tulsa, Oklahoma and Manhattan, Kansas. They gather and graph data on gangs in both areas.
Curated OER
Looking Normal
Students identify the shape of a function. In this statistics instructional activity, students plot the data collected. They analyze their data for positive, negative or no correlation. They find the line of best fit.
Curated OER
Math/Quilt Connection
Students explore quilting. In this math patterns lesson plan, students define the perimeter of a quilt border, create tessellations using geometric shapes, and detemine the area of a quilt.
Curated OER
Connecting Math to Our Lives
Students participate in an online interactive forum to explore how math is used in their families and communities. They design games to submit to other students online, and identify and organize data to solve the problems from other...
Curated OER
Michigan Virtual Field Trip
Students analyze data from a virtual field trip to Michigan. They conduct Internet research on mileage and travel time between cities, calculate and compare fuel costs, and research and calculate lodging, activities, and meal costs.
Curated OER
World Statistic Day
Eleventh graders collect data about the state they live in. In this statistics lesson, 11th graders collect and analyze data as they compare themselves to students in other states. They analyze data about a person's education level, and...
Curated OER
One, Two, Three...and They're Off
Learners make origami frogs to race. After the race they measure the distance raced, collect the data, enter it into a chart. They then find the mean, median, and mode of the data. Next, students enter this data into Excel at which time...
Curated OER
Range, Mean, Median, and Mode
Eighth graders find the range, median, mean, and mode of a data set. In this finding the range, median, mean, and mode of a data set lesson, 8th graders collect data about the high and low temperature for 10 different cities. ...
Curated OER
Recording Frequency
First graders analyze nursery rhymes and gather data about word frequency. In this frequency lesson, 1st graders create graphs and tables. Students interpret the data.
Curated OER
Charging Up, Charging Down
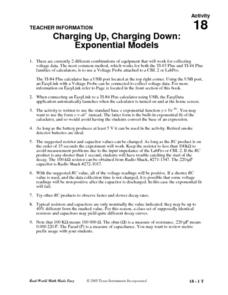
Learners collect and analyze voltage data. Then, they investigate exponential functions using the TI and a Voltage Probe and graph their data and analyze it using a table.
Curated OER
Reaction Time
Students record reaction time data and calculate minimum, maximum, mean, median, and mode. They participate in a class reaction time activity, observe and conduct an online experiment, and discuss and analyze the activity results.
Curated OER
The Big Hand Challenge
Students utilize a computer spreadsheet to record and analyze data. In this problem solving activity, students compare their hand size to that of the principal. Students understand standard and nonstandard measurement.
Curated OER
Determining Mean, Range, Median, Mode, and Probability
Students calculate mean, median, range, mode and probability. Then, working in teams, they use data from their workplace to compute values for these terms. Finally the class explores the term "probability" using a die.
Curated OER
What Does Average Look Like?
Fifth graders explore the concepts of range, median, mode, and mean through the use of graphs drawn from models. They use manipulatives to represent data they have collected within their groups, and compare the differences between mode,...
Curated OER
The Bouncing Ball
Students use the scientific method to conduct an experiment to test how a ball bounces. In this inquiry-based physical science and scientific method activity, students drop a ball from specified heights and record the rebound, then...
Curated OER
Tall Tale Rollers
Students explore American tall tales. In this tall tale lesson, students discover the six characteristics that are included in tall tales. Students survey their class to find each student's favorite tall tale character and organize the...
Curated OER
Walk the Line
Learners create constant speed versus motion graphs. They will perform linear regressions on their data to describe the graphs mathematically.
Curated OER
Polluting the Environment
Fourth graders construct mini-ecosystem, pollute the ecosystem, observe, collect, and record data on the effects of these pollutants on their ecosystem, organize data on spreadsheets, create graphs, and design presentations to share with...
Alabama Learning Exchange
Inch by Inch
Third graders listen to a read-aloud of Leo Lionni's, Inch by Inch before measuring a variety of items using both standard and metric units. They record the measurement data and follow a recipe for dirt pie.


