Chapman University
Scientific Alphabet Chart - Get to Know Your Greek Alphabet
Greek alphabet letters are used to represent words or values in science and math. Keep a list on hand to refer to while working through calculus or physics problems.
Curated OER
Graphing the Four Forces
Using the Cartesian coordinate system, future flight experts plot points to determine whether or not an airplane will fly. With the four forces of weight, lift, drag, and thrust represented in different quadrants, your physics learners...
Curated OER
Industrialization, Chemicals and Human Health - Math
Students review the units of the metric system, and practice estimating measures before actually converting between the two systems of measurement. They participate in activities to visualize a concentration of one part per million....
Curated OER
Position and Time Graphs
A series of graphs are displayed with points plotted for time and position. A question is asked for each, requiring your class to view one axis and track its partner coordinate. A few examples are given to begin each section, and so this...
Curated OER
Ellipses and Kepler's First Law
The class examines graphs in the form r = F(¿¿) in polar coordinates (r, ¿¿), in particular with the circle, ellipse and other conic sections. They determine the nature of an ellipse by studying the role of the semimajor axis and...
Curated OER
NIGHT AND DAY: DAILY CYCLES IN SOLAR RADIATION
Students examine how Earth's rotation causes daily cycles in solar energy using a microset of satellite data to investigate the Earth's daily radiation budget and locating map locations using latitude and longitude coordinates.
Curated OER
Stars and Slopes
More of a math lesson than physics or space science, high schoolers take a set of data and plot it on a log-log coordinate system. The write-up for day two was never completed, but day one, "Stars and Slopes," is complex and cohesive....
Curated OER
Science: Matter and Energy
Designed to use when teaching adults preparing for their high school equivalency exam, the resource integrates reading practice, writing, and analytical thinking in every lesson. The unit covers 23 topics, but it only includes three...
New York State Education Department
TASC Transition Curriculum: Workshop 13
The six instructional shifts in this workshop definitely move math and science teachers' understanding of instruction. The workshop, 13th out of a series of 15, asks participants to examine sample tests and to look at how the six...
Curated OER
Using Coordinate Geometry by Land, Sea and Outer Space.
Students complete a table of values and plot points, as well as construct a graph on a coordinate grid. They construct two graphs on the same coordinate system, and identify the point of intersection. Students represent and record...
Curated OER
LAND USE ISSUES
Young scholars relate math with real life situations. They identify and plot points on a grid map. They identify and locate the Drop Box Sites.
Curated OER
Distances Between Stars
In this distance between stars worksheet, students use the 3-dimensional distance formula and Cartesian coordinates to find the distances of 10 given stars from the sun. They also determine which constellation each star belongs to and...
Illustrative Mathematics
Weather Graph Data
Teaching young mathematicians about collecting and analyzing data allows for a variety of fun and engaging activities. Here, children observe the weather every day for a month, recording their observations in the form of a bar graph....
Curated OER
How Big is a Dinosaur?
Fourth graders create enlarged replica of a stegosaurus drawing, using a grid to practice coordinates.
Curated OER
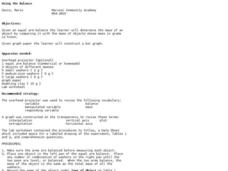
Using the Balance
Students determine the mass of various objects. In this integrated math and science lesson plan, students use an arm balance to compare a known object to a combination of washers with a fixed weight. Students record data, construct a bar...
Curated OER
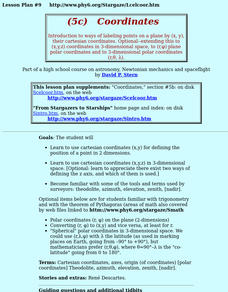
Coordinates
Students use cartesian coordinates (x,y,z) in 3-dimensional space. [Optional: appreciate there exist two ways of defining the z axis, and which of them is used.] They become familiar with the tools and terms used by surveyors.
Curated OER
Slope, Vectors, and Wind Pressure
A hands-on lesson using the TI-CBR Motion Detector to provide information to graph and analyze. The class uses this information to calculate the slope of motion graphs and differentiate scalar and vector quantities. There is a real-world...
Curated OER
Applications of the Pythagorean Theorem - Magnetism
Middle and high schoolers use the Pythagorean Theorem to complete a table showing with the magnetic field strengths in given cities. They find the average value of the Earth's magnetic field and plot one of the three-dimensional values...
Curated OER
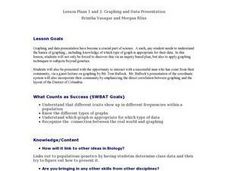
Graphing And Data Presentation
High schoolers engage in a study of science and mathematics with the practice of creating graphs. A guest speaker comes to the class to share statistics from the community and the students are shown how he uses the coordinate system in...
Curated OER
Speed
Fifth and sixth graders practice working in pairs to determine whether they can walk with constant speed. They test themselves, collect their data, draw graphs with their data collected, manipulate the data, and then draw conclusions...
CK-12 Foundation
Position and Displacement Simulation
How can we use vectors to determine a person's position when traveling? The simulation offers guided practice at determining the coordinates and the distance between coordinates on a map grid. It reinforces the importance of positive...
Curated OER
Earth Science Regents: The Ellipse
Starting with the instructions to draw an ellipse, and with great pictures, this sheet should help your pupils learn the shapes and measurements involved. Using push pins and string, your class can discover the axis and focus points...
Curated OER
INTERPRETING MAGNETIC FIELD MAPS
Students interpret magnetic field maps, rotate the coordinates to obtain different views, change the coordinate representation, and produce alternate graphical representations.
Curated OER
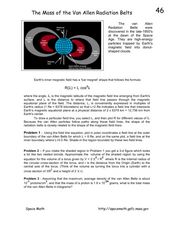
The Mass of the Van Allen Radiation Belts
In this van Allen Radiation Belts worksheet, students are given the formula for the field line of the Earth's inner magnetic field. Students use this equation to find the polar coordinates of a field line in the van Allen Belts. They...
Other popular searches
- Halloween Math Coordinates
- Christmas Math Coordinates
- Math Coordinates Picture
- Math Coordinates Animals
- Fifth Grade Math Coordinates
- Math Coordinates Game
- Math Coordinates Sailboat
- Grid Coordinates in Math
- Coordinates in Math


