EngageNY
Some Facts About Graphs of Linear Equations in Two Variables
Develop another way to find the equation of a line. The lesson introduces the procedure to find the equation of a line given two points on the line. Pupils determine the two points from the graph of the line.
Curated OER
The Distance and Midpoint Formula
In this college level mathematics worksheet, students solve use the Pythagorean Theorem to find the missing side of a right triangle and explore the connection between the Pythagorean Theorem and the distance formula....
Charleston School District
Graphing Functions
How do letters and numbers create a picture? Scholars learn to create input/output tables to graph functions. They graph both linear and nonlinear functions by creating tables and plotting points.
Virginia Department of Education
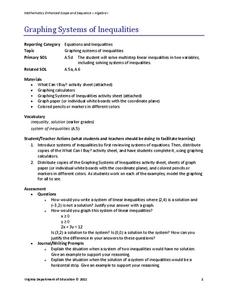
Graphing Systems of Inequalities
Apply systems of inequalities to a real-world problem. Here, scholars learn to graph solutions to systems of linear inequalities. To finish the lesson, they solve a problem involving burgers and cheeseburgers using a system of inequalities.
Inside Mathematics
Graphs (2006)
When told to describe a line, do your pupils list its color, length, and which side is high or low? Use a worksheet that engages scholars to properly label line graphs. It then requests two applied reasoning answers.
EngageNY
Geometric Interpretations of the Solutions of a Linear System
An intersection is more than just the point where lines intersect; explain this and the meaning of the intersection to your class. The 26th segment in a 33-part series uses graphing to solve systems of equations. Pupils graph linear...
EngageNY
Mid-Module Assessment Task: Grade 7 Mathematics Module 4
Assess the ability of the class to solve percent problems with an assessment that covers a variety of percent problems from basic to multi-step. Pupils make connections between percent problems and proportional thinking to complete...
EngageNY
The Line Joining Two Distinct Points of the Graph y=mx+b Has Slope m
Investigate the relationship between the slope-intercept form and the slope of the graph. The lesson plan leads an investigation of the slope-intercept equation of a line and its slope. Pupils realize the slope is the same as the...
Ohio Literacy Resource Center
Solving Systems of Linear Equations Graphing
Do you need to graph lines to see the point? A thorough lesson plan provides comprehensive instruction focused on solving systems of equations by graphing. Resources include guided practice worksheet, skill practice worksheet,...
Noyce Foundation
Photographs
Scaling needs to be picture perfect. Pupils use proportional reasoning to find the missing dimension of a photo. Class members determine the sizes of paper needed for two configurations of pictures in the short assessment task.
Inside Mathematics
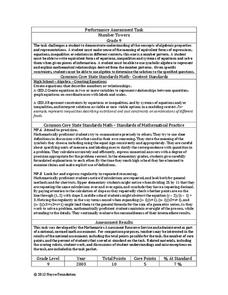
Number Towers
Number towers use addition or multiplication to ensure each level is equal. While this is common in factoring, it is often not used with algebraic equations. Solving these six questions relies on problem solving skills and being able to...
EngageNY
Constant Rate
Two-variable equations can express a constant rate situation. The lesson presents several constant rate problems. Pupils use the stated constant rate to create a linear equation, find values in a table, and graph the points. The resource...
EngageNY
The Graph of a Linear Equation—Horizontal and Vertical Lines
Graph linear equations in standard form with one coefficient equal to zero. The lesson plan reviews graphing lines in standard form and moves to having y-coefficient zero. Pupils determine the orientation of the line and, through a...
EngageNY
The Computation of the Slope of a Non-Vertical Line
Determine the slope when the unit rate is difficult to see. The 17th part of a 33-part series presents a situation that calls for a method to calculate the slope for any two points. It provides examples when the slope is hard to...
EngageNY
There is Only One Line Passing Through a Given Point with a Given Slope
Prove that an equation in slope-intercept form names only one line. At the beginning, the teacher leads the class through a proof that there is only one line passing through a given point with a given slope using contradiction. The 19th...
EngageNY
The Graph of a Linear Equation in Two Variables Is a Line
Show your class that linear equations produce graphs of lines. The 20th segment in a unit of 33 provides proof that the graph of a two-variable linear equation is a line. Scholars graph linear equations using two points, either from...
EngageNY
Every Line is a Graph of a Linear Equation
Challenge the class to determine the equation of a line. The 21st part in a 33-part series begins with a proof that every line is a graph of a linear equation. Pupils use that information to find the slope-intercept form of the...
Noyce Foundation
Cereal
Find the best protein-packed cereal. The short assessment task covers equivalent and comparing ratios within a context. Pupils determine the cereal with the highest ratio of protein. A rubric helps teachers with point allotments for...
Charleston School District
Identifying Series and Determining Congruence or Similarity
Learners consider a set of questions to determine a series of transformations that will move one figure to another. Once the series is determined, the pupil then determines whether the pre-image and image are either congruent...
Charleston School District
Sketching a Piecewise Function
How do you combine linear and nonlinear functions? You piece them together! The lesson begins by analyzing given linear piecewise functions and then introduces nonlinear parts. Then the process is reversed to create graphs from given...
Charleston School District
Review Unit 4: Linear Functions
It's time to show what they know! An assessment review concludes a five-part series about linear functions. It covers all concepts featured throughout the unit, including linear equations, graphs, tables, and problem solving.
Charleston School District
Review Unit 8: Geometry Applicaitons
Pupils complete a review worksheet that highlights the key problems from the first eight lessons in the series. Topics include the Pythagorean Theorem and its converse, as well as finding volume of three-dimensional figures.
Curated OER
Geometry Concepts and Applications
For this concepts and applications review worksheet, 10th graders solve and complete 40 various types of multiple choice problems. First, they write the equation of a vertical line passing through a point. Then, students find the...
Curated OER
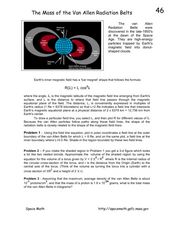
The Mass of the Van Allen Radiation Belts
In this van Allen Radiation Belts worksheet, students are given the formula for the field line of the Earth's inner magnetic field. Students use this equation to find the polar coordinates of a field line in the van Allen Belts. They...
Other popular searches
- Coordinate Planes Math
- Math Coordinate Plane Blank
- Cartesian Math
- Coordinate Planes Math Free
- Coordinate Grid Math
- Ell Math Coordinate Plane


