Noyce Foundation
Ducklings
The class gets their mean and median all in a row with an assessment task that uses a population of ducklings to work with data displays and measures of central tendency. Pupils create a frequency chart and calculate the mean and median....
Curated OER
Fast Food Survey Using Bar Graphs
Second graders conduct survey and sort data according to categories, construct bar graph with intervals of 1, and write a few sentences about their graphs.
Curated OER
Bar Graphs Using M & Ms
Fifth graders observe an overhead of a graph on which M & Ms have been poured out. A volunteer comes up and separates the colors writing on the overhead how many there were of each color and another person labels the graph's title....
Curated OER
Frequency, Histograms, Bar Graphs
For this statistics worksheet, students plot and graph their data, then interpret the data using the correct form of graphs. There are 3 detailed questions with an answer key.
Curated OER
Are You Full of Hot Air?
Explore the concept of measuring and recording circumference. In this physical science and measurement lesson, young learners blow up balloons, measure the circumference, and record the data on an interactive graphing website.
Curated OER
Get Ready For Some Football
Sixth graders compare and contrast the totals from two national football teams for the year. Using the internet, they search for the information they need and create a data bar graph. They use the information they collected to answer...
Curated OER
Slavery: Population Growth in Arkansas
Eighth graders examine the number of slaves in Arkansas in each census period from 1820 to 1860. They graph the data using the proper labeling and write a paragraph summarizing the data from each period making comparisons between slave...
Curated OER
The Price is Right
Students, through various activities, explore online databases. Using the internet, students explore the distributors websites. They collect specific information on selected products. An spreadsheet with price comparisons is developed....
Curated OER
Writing Variable Expressions for Physical Models
Explore the concept of writing variable expressions by examining the similarities between expressions with numbers and expressions with variables. Emerging mathematicians determine rules for sequences and patterns before writing a rule...
Curated OER
Count The Letters
Students perform activities involving ratios, proportions and percents. Given a newspaper article, groups of students count the number of letters in a given area. They use calculators and data collected to construct a pie chart and bar...
Curated OER
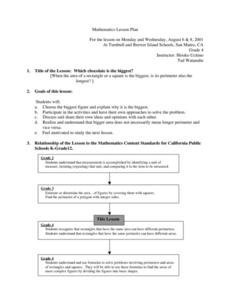
Which Chocolate Is The Biggest?
Students investigate the concepts of area and perimeter with the use of chocolate bars. They calculate the perimeter and area of different size rectangle chocolate bars and record the statistics. Then students make a visual comparison...
K-5 Math Teaching Resources
Fraction Strips
Reach out to your visual and kinesthetic learners with this set of printable fraction strips. Not only is this resource a great way to develop children's fractional number sense, it's bound to capture their engagement as well.
Curated OER
The Take-Awar Bar 1
Students use an Internet tool, "The Take-Away Bar" to solve subtraction problems by breaking them into parts. They write and solve comparison problems. Students make sensible estimates and check the reasonableness of answers. They use...
Curated OER
Comparing Candy Bars
Eighth graders identify that a ratio is a comparison of two numbers and that a proportion is an equation that equates two ratios. They identify the extremes and means of proportions, as well as the product of the extremes equals the...
Curated OER
Math and Cinderella
Young scholars trace their feet and them compare the different sizes of classmates. They construct a bar graph showing the results of their classmates' feet size. They discuss what kinds of conclusions can be drawn from their observations.
Curated OER
When Dinosaurs Ruled the World
Students graph the varying sizes of dinosaurs. In this math and dinosaur activity, students view dinosaur models and compare the different shapes and sizes of the dinosaurs. Students complete a dinosaur math activity, read The Dinosaur...
Curated OER
When is Your Birthday?
Students use data about their birthdays to create graphs. In this collecting and communicating information instructional activity, students make a class list of their birthdays. Students use the information to make a bar graph showing...
Curated OER
Flight of Angles of Inclination
Students measure the flight of a gilder. In this fight of angles lesson, students explore the flight of a glider and measure the distance flown. They collect statistical data of the flights and determine the slope of each flight. ...
Alabama Learning Exchange
Jelly Beans Add Up
Young scholars explore counting, sorting, and graphing skills. In this data analysis lesson plan, students sort jelly beans by color, count the jelly beans, and create a bar graph of the jelly beans according to color.
Curated OER
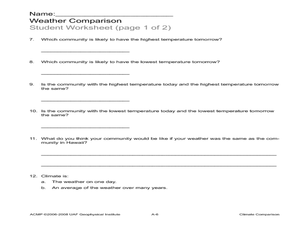
Climate Comparison
Students explore climate regions. In this climate activity, students examine the climate regions of Alaska as well as the state of Hawaii. Students research selected Internet sources to gather information regarding the climates present...
Curated OER
Comparison of Two Different Gender Sports Teams - Part 1 of 3 Measures of Central Tendency
Students gather and analyze data from sports teams. In this measures of central tendency lesson, students gather information from websites about sports team performance. Students analyze and draw conclusions from this data. This lesson...
Curated OER
Statistics Newscast in Math Class
Students study sports teams, gather data about the teams, and create a newscast about their data. In this sports analysis lesson, students research two teams and define their statistical data. Students compare the two teams, make...
National Council of Teachers of Mathematics
The Roll Out Fractions Game: Comparing Fractions
Reinforce the concept of comparing fractions with a hands-on, two-player game that calls for a visual model, score board, and dice. Players roll dice to acquire their given fraction, create the fraction using fraction tiles, then compare...
Noyce Foundation
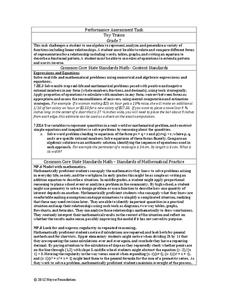
Toy Trains
Scholars identify and continue the numerical pattern for the number of wheels on a train. Using the established pattern and its inverse, they determine whether a number of wheels is possible. Pupils finish by developing an algebraic...


