Curated OER
Weather instruments
Students explore weather instruments. In this weather lesson, students make rain gauges, anemometers, and barometers following the instructions given in the lesson. Students set up a weather station using their instruments and record and...
National Security Agency
What’s Your Coordinate?
Your middle schoolers will show what they know with their bodies when they become the coordinate plane in this conceptual development unit. Starting with the characteristics of the coordinate plane, learners develop their skills by...
Illustrative Mathematics
Stained Glass
A complex question looking for the total cost of a stained glass window by calculating area and circumference of a circle. With detailed components, this activity will challenge your designers to figure out if they have enough money to...
Illustrative Mathematics
Shape Hunt Part 2
Shapes are everywhere in the world around us, from rectangular doors to the circular wheels of a car. The second lesson plan in this series opens the eyes of young mathematicians to this wonderful world of shapes as they search the...
West Contra Costa Unified School District
Key Features of Graphs
The key is ... After a day of instruction on key features of graphs, groups create a poster and presentation on the key features of their given function graph. The resource provides an extension activity of "telephone" using...
West Contra Costa Unified School District
Investigating Similar Triangles
Let your use of the resource be in proportion to its usefulness. Pupils investigate similar triangles by measuring side lengths and considering given angle measures. The results of the investigation help develop generalizations about...
Curated OER
Wildlife
The centerpiece of this lesson plan is a predator-prey simulation in which colored paperclips represent different species of animals camouflaged against a colored background. Relevant follow-up questions are provided. The activity is...
Curated OER
Numbers and Counting
Students explore the numbers one through five. Over a three week period, students visit centers in the room to investigate and perform hands-on activities with numbers. They trace numbers, write numbers in shaving cream, count objects,...
Curated OER
Adding Note Values
Students use the values of musical notes to complete math problems. They study the names and values of musical notes, define the word beat as it relates to music. They complete math problems using music note values.
Curated OER
Plotting Amish Farmland
Second graders listen to the book, Down Buttermilk Lane by Barbara Mitchell. They discover how to read a grid and then together as a class, plot 2 squares, one yellow and one green. Then they plot the remaining squares independently and...
Curated OER
Quilt Patch Proof
Students construct a convincing argument that the same amount of fabric is needed for each color of quilt being made in a specific design. They justify the relationship between vertical angles and the sum of the interior angles. Students
Curated OER
Fractions: 1/2
In this fraction learning exercise, students find shapes in rows that show 1/2 and color them, 6 rows of 3 shapes each. Worksheet is labeled as a sample from a subscription site.
Curated OER
Thirds
In this thirds learning exercise, students find the shapes that show thirds and color the examples that show 1/3. Students solve 7 problems.
Curated OER
Fourths
In this fourths worksheet, students find the shapes that show fourths. Students color in the images to illustrate 1/4 for the 6 problems.
Curated OER
Addition
In this block addition worksheet, 1st graders write addition sentences using the colored blocks. Students count the block sets and write them in for addition sentences. Students solve 11 problems.
Curated OER
Fractions
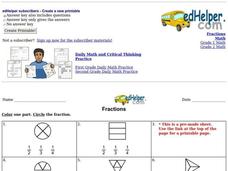
In this fractions worksheet, students enhance their understanding of fractions by coloring one part of each figure and then circling the fraction for the 11 problems.
Curated OER
Addition
In this addition worksheet, students use the color blocks to complete the 11 addition problems. Students fill in the missing numbers to solve the problems.
EdHelper
Temperature
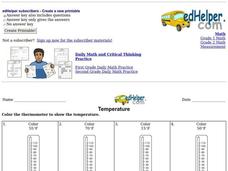
In this temperature activity, students color the thermometer to show the temperature. Students find the temperature for 7 thermometers.
EdHelper
Temperature
In this temperature worksheet, students read the given degrees and then color the thermometers to show the temperature for the 7 problems.
University of Arizona
Skittles & M&Ms Probability Experiment
Students are introduced to the scientific method by hypothesizing, counting, analyzing and concluding which company packs candy more reliably - Skittles or M&Ms.
Curated OER
Lesson Plan One: Points, Lines, Rays
Fifth graders explore basic geometric terms. Pupils draw a physical picture of a scene that illustrates at least five geometric terms. Partners exchange drawings and locate the illustration of geometric terms in the drawing.
Curated OER
Place Value Chocolates
In this place value worksheet, learners see 4 digit numbers in chocolates that they match to the clues in the chocolate box. Students complete 10 matches.
Curated OER
Calculating Parts per Million: Do We Have a Problem Here?
Students calculate ppm and ppb by using unit analysis when given a ratio of amounts.
They determine in ppm what constitutes a health risk for a particular toxin given data
and whether local health officials should close a lake...
Curated OER
Usage and Interpretation of Graphs
Students explore graphing. In this graphing lesson, students predict how many shoe eyelets are present in the classroom. Students count eyelets and work in groups to organize and chart the data collected. Students put all the data...


