Curated OER
Going Graph-y
Second graders listen to and dicuss the story Where the Wild Things Are. They play a pantomime game and act out various feelings so their classmates can guess. They listen for the frequency of certain words, and record their findings on...
Curated OER
Twelve Days of Christmas--Prediction, Estimation, Addition, Table and Chart
Scholars explore graphing. They will listen to and sing "The Twelve Days of Christmas" and estimate how many gifts were mentioned in the song. Then complete a data chart representing each gift given in the song. They also construct...
Curated OER
Best-Selling Books Bar Graph
Students fill in bar graphs to show ten of the best-selling students' books of all time. Students create simple bar graphs to show how many copies of each of the ten books have been sold.
Curated OER
All About Graphs
Learners practice organizing data by creating graphs. In this statistics lesson, students survey the class about favorite colors and create a bar graph using the data. Learners complete a test based on pet and animal statistics.
Curated OER
Best-Selling Books Bar Graph
Create a bar graph with your elementary school learners. First they read and interpret data, and then they color in the graph (provided) to indicate how many of each were sold. Consider providing them with the data but having them...
Curated OER
Count the Images!
Based on a selection of images, learners create a bar graph depicting how many of each image is shown. There are two graphs, each with three images to chart. After they are finished, scholars can analyze the data and draw conclusions. To...
Curated OER
Close Observation: Coins
Integrate math, science, and speaking/listening with a collaborative hands-on activity. Each group works with a single penny, examining it with the naked eye and recording observations. Repeat using magnifying glasses. Then repeat with a...
Curated OER
Jack and the Beanstalk Math
Students listen to Jack and the Beanstalk and determine what they think are the most common words. In this Jack and the Beanstalk lesson plan, students reread the story, count the words they chosen and graph those words. Students graph...
Curated OER
Cricket Weather
In this collecting data worksheet, 4th graders use the data collected on crickets chirps and the temperature to make a line graph by following 4 directives.
Curated OER
Pictograms
Have your class practice using a pictogram with this resource. Learners count tally marks, and answer a few questions related to the graph. Afterwards, they could create their own pictograms.
Curated OER
A Reading Graph
Students construct and interpret a "favorite classroom books" graph. In this literacy and math graphing lesson, students choose a reduced size copy of the book cover that corresponds with the book(s) they chose to read during their...
Curated OER
Bunny Cakes and Graphing
Third graders graph and analyze data relating to the book "Bunny Cakes" by Rosemary Wells. They listen to and discuss the book, vote on their favorite cake using Excel computer software, and discuss the results.
Curated OER
Green Food Graph
Young scholars explore graph making by investigating St. Patrick's day food. In this holiday food lesson, students discuss their favorite green foods in honor of St. Patrick's day. Young scholars create a graph based on the data of which...
Curated OER
Graphing With Paper and Computers
Fourth graders construct bar graphs. In this graphing lesson, 4th graders create bar graphs in connection with the story, The Copycat Fish. After creating the initial graphs on paper, students use MS Excel to create graphs.
Curated OER
A Proportional Fish Story
In this proportions learning exercise, students identify and complete 8 different problems that include using proportions to build scale models of various animals. First, they use the scale to complete the chart and draw lines...
Curated OER
Are You My Little Peanut?
Fourth graders explore the mass and length of peanuts by pretending to parent a peanut. In this mode, median and range lesson students graph their measurements and then use them to find the mode, median and range. Students discuss peanut...
Curated OER
Gold Rush California and its Diverse Population
Young scholars compare contemporary cultural differences with historical differences based on population percentage. In this cross-curriculum Gold Rush/math lesson, students analyze aspects of California's Gold Rush population and...
Curated OER
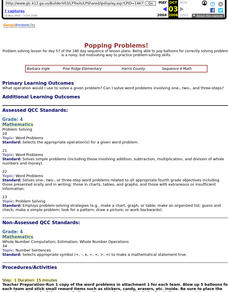
Popping Problems!
Turn your math instructional activity into a carnival game with this fun, outdoor activity. After reviewing the concept your class will be practicing briefly, split your class up into teams and head outdoors. These teams work to solve...
Curated OER
How Many Letters Are In Your Name?
Young scholars discover how to make a graph that represents the number of letters in their names. In this early childhood math lesson plan, students collect data, categorize data, and develop skills to analyze the pieces of data.
Curated OER
Voter Turnout
Explore politics by analyzing the voting process. Pupils discuss the purpose of casting votes in an election, then examine graphs based on the data from a previously held election's turnout. The lesson concludes as they answer study...
Curated OER
Weather instruments
Young scholars explore weather instruments. In this weather lesson plan, students make rain gauges, anemometers, and barometers following the instructions given in the lesson plan. Young scholars set up a weather station using their...
Curated OER
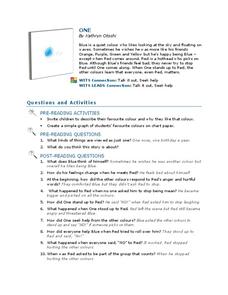
One
First graders listen to the story One and design a favorite color graph. For this language arts lesson, learners answer comprehension questions and discover the importance of standing up for a friend. They complete a worksheet about...
The New York Times
Understanding the Mathematics of the Fiscal Cliff
What exactly is the fiscal cliff? What are the effects of changing income tax rates and payroll tax rates? Your learners will begin by reading news articles and examining graphs illustrating the "Bush tax cuts" of 2001 and 2003. They...
Curated OER
Favorite Pets
In this tally chart worksheet, students finish filling in a chart involving a survey of favorite pets from a particular class. Students then answer 4 short answer questions about the results of the survey.


