Hi, what do you want to do?
Primary Resources
Primary Resources: Line Graphs and Pie Charts
Here are a few resources to use with your students when teaching about line graphs or pie charts.
Wolfram Research
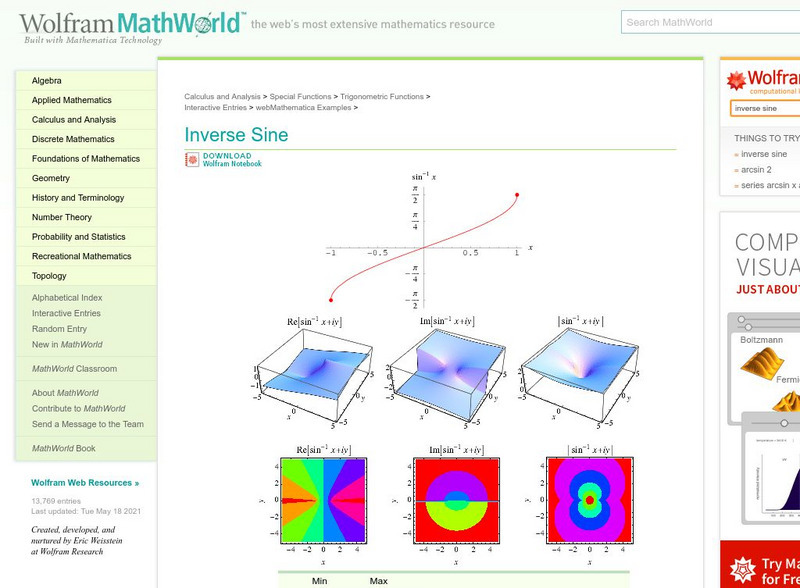
Wolfram Math World: Inverse Sine
This is a math site on the inverse of sine. Includes charts, color graphs, formulas including the Maclaurin series, as well as links to math terms and subject areas used within the site.
Texas Instruments
Texas Instruments: Mc Dougal Littell Middle School Math: Making Data Displays
Students will create data displays using a scatter plot and a line graph of the data and a circle graph of survey data.
Wolfram Research
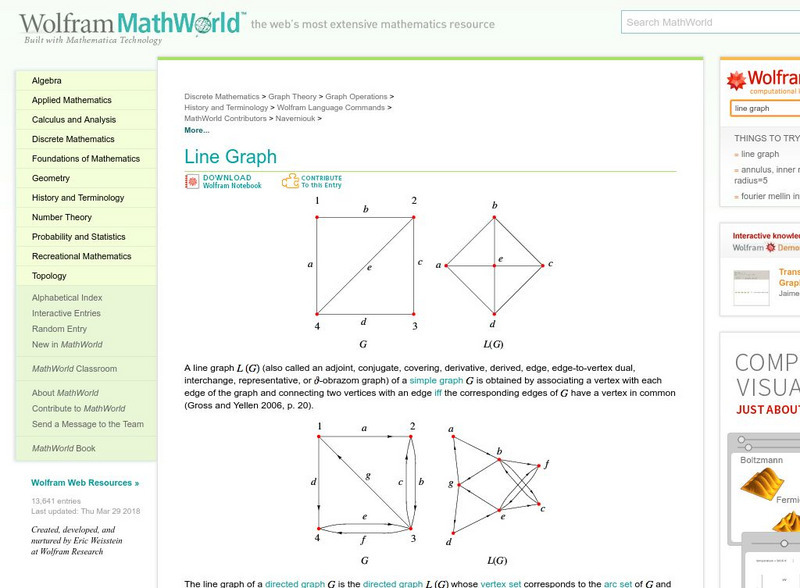
Wolfram Math World: Line Graph
Definition of a line graph with a variety of examples. Includes maps, charts, and detailed explanations for understanding.
E-learning for Kids
E Learning for Kids: Math: Tea Store: Reading a Table
Students will demonstrate how to interpret information in a table.
The Math League
The Math League: Using Data and Statistics: Pie Charts
This introductory tutorial about statistical graphing with four examples of how pie charts (circle graphs) are constructed and read.
Scholastic
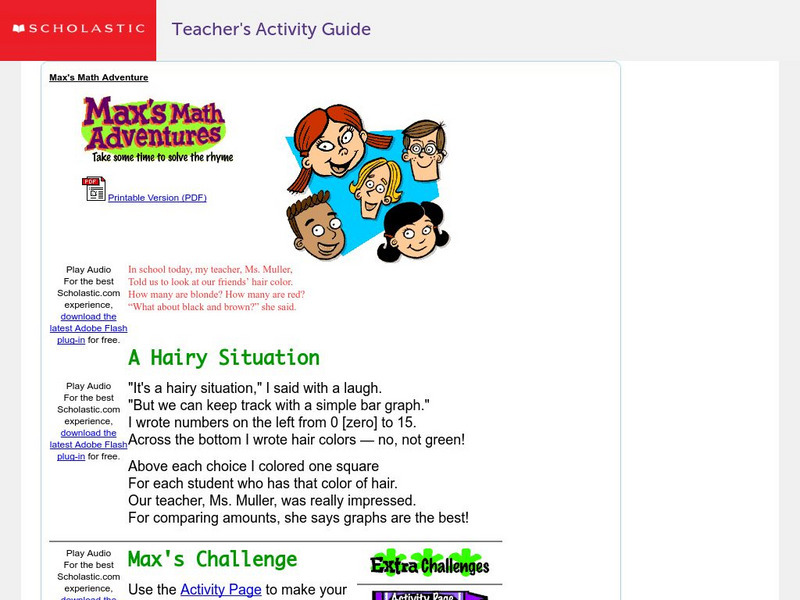
Scholastic: Max's Math Adventures: A Hairy Situation
Help Max make a bar graph to show the hair colors of his classmates. Teachers will appreciate the activities with bar graphs in the extra challenges. Use the teacher's guide to create a fun and engaging lesson.
The Math League
The Math League: Using Data and Statistics
This site contains two short examples of line graphs, charts that show change over time. This is a quick introduction to the topic of statistical graphing.
ClassFlow
Class Flow: Interpreting Tables and Graphs
[Free Registration/Login Required] Explore a variety of graphs and tables. Many activities are incorporated to provide practice solving problems using different graphs and charts.
Oswego City School District
Regents Exam Prep Center: Practice With Organizing and Interpreting Data
Several problems are presented to test your skills in creating and interpreting frequency tables, pie charts, box-and-whisker and stem-and-leaf plots.
Alabama Learning Exchange
Alex: Ice Cream Sundae Survey
Learners quickly realize the importance of learning how to read and find information in charts, graphs, and tables compared to finding the same information written in a paragraph. This is a fun, high energy lesson!This lesson plan was...
Math Is Fun
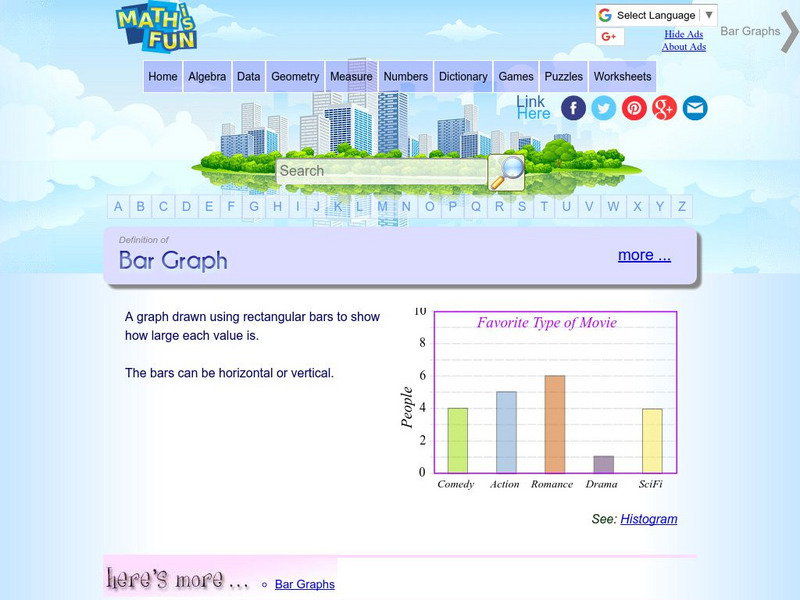
Math Is Fun: Definition of Bar Graph
Get the definition for a bar graph. Then, select the link "here's more" and use the interactive graph to display data as a bar graph, line graph or pie chart. The finished graph may be printed.
Wolfram Research
Wolfram Math World: Pie Chart
This page briefly discusses the use of pie charts (or circle graphs) in representing data. Provides detailed information for understanding.
TeacherLED
Teacher Led Interactive Whiteboard Resource Survey
Students can explore surveys, pie charts, and bar graphs with this interactive white board resource.
The Math League
The Math League: Ratio and Proportion
This tutorial provides definitions and examples of ratios and proportions and features comparing ratios and converting rates.
Texas A&M University
Texas A&m University: Moments of Inertia
This site is from the Math department of the Texas A&M University and contains wonderful information on Centers of mass and moments of inertia. Pictures, charts, graphs along with great text is all included.
Other
Ns Dept. Of Education: Blackline Masters, Grades P to 9
Templates that are widely used in elementary to middle school Math are found here. There is a wide assortment of everything from hundreds charts to graph paper to 3-D nets. They are available in both Word and Adobe Acrobat formats.
Other
Ns Dept. Of Education: Blackline Masters, Grades P to 9
Templates that are widely used in elementary to middle school Math are found here. There is a wide assortment of everything from hundreds charts to graph paper to 3-D nets. They are available in both Word and Adobe Acrobat formats.
PBS
Pbs Kids Afterschool Adventure!: Operation: All About Us Activity Plan
It's time to stand in the spotlight! During this Afterschool Adventure, children will learn about and practice a variety of math skills as they gather information about their favorite subject-themselves! Children will start out by...
Math Medics
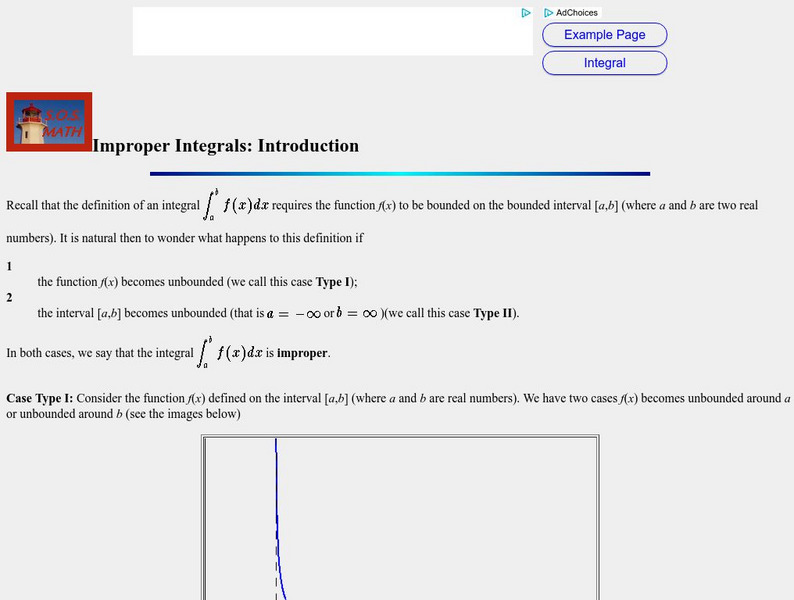
S.o.s. Math: Improper Integrals: Introduction
A detailed and comprehensive lesson explaining improper integrals. It contains many graphs and charts.
Other
Math Stories: Draw a Picture
At this one page site you can work through step by step a sample problem that illustrates the problem solving strategy for "Draw a picture." The answer is right there to help you check your thinking.
Lumen Learning
Lumen: Critical Reading: Specialized Reading Strategies
This lesson focuses on specialized reading strategies such as online reading, reading in math, science, etc., and reading charts and graphs. It provides text, videos, charts and graphs, graphics, and a self-check.
PBS
Pbs: Mathline Creature Feature Lesson Plan [Pdf]
An interdisciplinary math, science, and language arts lesson that engages students in an exploration of statistics. Through a study of various forest climates, students utilize data collection and analysis, classification, and graphing....
PBS
Pbs Learning Media: Peg + Cat Collection
The Peg + Cat on-air series and online resources provide many opportunities for educators to introduce or reinforce early math concepts. In each 11-minute on-air episode of this animated, math-based series for 3-8 year olds, Peg and Cat...


