Khan Academy
Khan Academy: Reading Dot Plots & Frequency Tables
Practice reading basic dot plots and frequency tables. Students receive immediate feedback and have the opportunity to try questions repeatedly, watch a video or receive hints.
Khan Academy
Khan Academy: Comparing Data Displays
Practice interpreting and comparing dot plots, histograms, and box plots. Students receive immediate feedback and have the opportunity to try questions repeatedly, watch a video or receive hints.
Khan Academy
Khan Academy: Creating Frequency Tables
In this exercise, students practice creating frequency tables. Students receive immediate feedback and have the opportunity to get hints and try questions repeatedly.
Khan Academy
Khan Academy: Creating Frequency Tables
Practice creating frequency tables from small data sets. Students receive immediate feedback and have the opportunity to try questions repeatedly, watch a video or receive hints.
Khan Academy
Khan Academy: Calculating the Median: Data Displays
Practice computing the median of data sets presented in a variety of formats, such as frequency tables and dot plots. Students receive immediate feedback and have the opportunity to try questions repeatedly, watch a video or receive hints.
Khan Academy
Khan Academy: Creating Dot Plots
Practice creating dot plots. Dot plots are very similar to frequency tables, but they make it easier to see the data. Students receive immediate feedback and have the opportunity to try questions repeatedly, watch a video or receive hints.
Khan Academy
Khan Academy: Create Histograms
Practice creating histograms. Students receive immediate feedback and have the opportunity to try questions repeatedly, watch a video or receive hints.
Khan Academy
Khan Academy: Interpreting Quartiles
Practice understanding the meaning of quartiles of data sets. Students receive immediate feedback and have the opportunity to try questions repeatedly, watch a video or receive hints.
Math Aids
Math Aids: Graph Worksheets
Great resource to practice and strengthen math skills pertaining to graphs. Math worksheets are printable, may be customized, and include answer keys.
Math Is Fun
Math Is Fun: Data Graphs
Create and customize a bar graph, line graph, or pie chart based on a set of data and print it out.
Math Is Fun
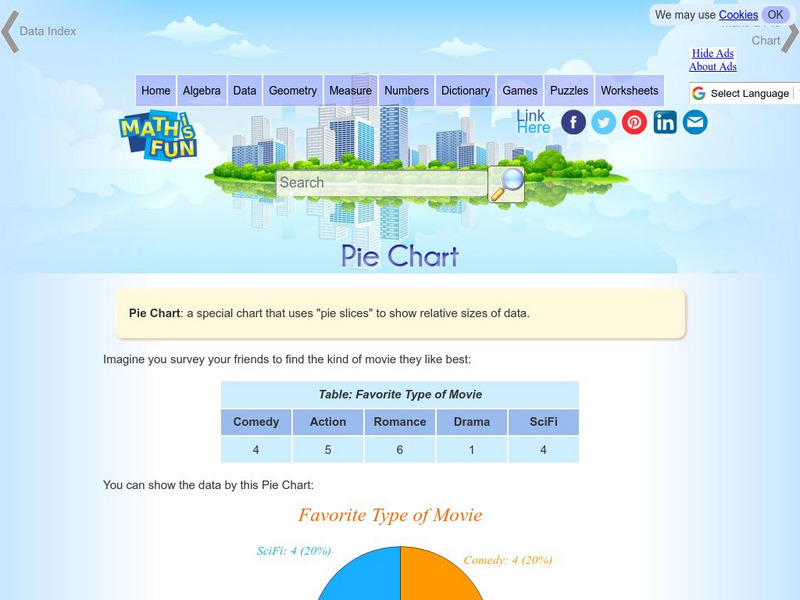
Math Is Fun: Pie Chart
Explains, with examples, what a pie chart is and how to make one. Includes a set of practice questions.
TeacherLED
Teacher Led Interactive Whiteboard Resource Survey
Students can explore surveys, pie charts, and bar graphs with this interactive white board resource.
Other
Ns Dept. Of Education: Blackline Masters, Grades P to 9
Templates that are widely used in elementary to middle school Math are found here. There is a wide assortment of everything from hundreds charts to graph paper to 3-D nets. They are available in both Word and Adobe Acrobat formats.
Other
Ns Dept. Of Education: Blackline Masters, Grades P to 9
Templates that are widely used in elementary to middle school Math are found here. There is a wide assortment of everything from hundreds charts to graph paper to 3-D nets. They are available in both Word and Adobe Acrobat formats.
Texas Instruments
Texas Instruments: Mc Dougal Littell Middle School Math: Making Data Displays
Students will create data displays using a scatter plot and a line graph of the data and a circle graph of survey data.
The Math League
The Math League: Ratio and Proportion
This tutorial provides definitions and examples of ratios and proportions and features comparing ratios and converting rates.
The Math League
The Math League: Using Data and Statistics
This site contains two short examples of line graphs, charts that show change over time. This is a quick introduction to the topic of statistical graphing.
Alabama Learning Exchange
Alex: Determining Percent of Seed Germination
In this project, students will conduct an experiment to determine the percentage of seed that will germinate in a given time frame. Students will produce charts and graphs to represent the results algebraically. Mathematics and...
University of Cambridge
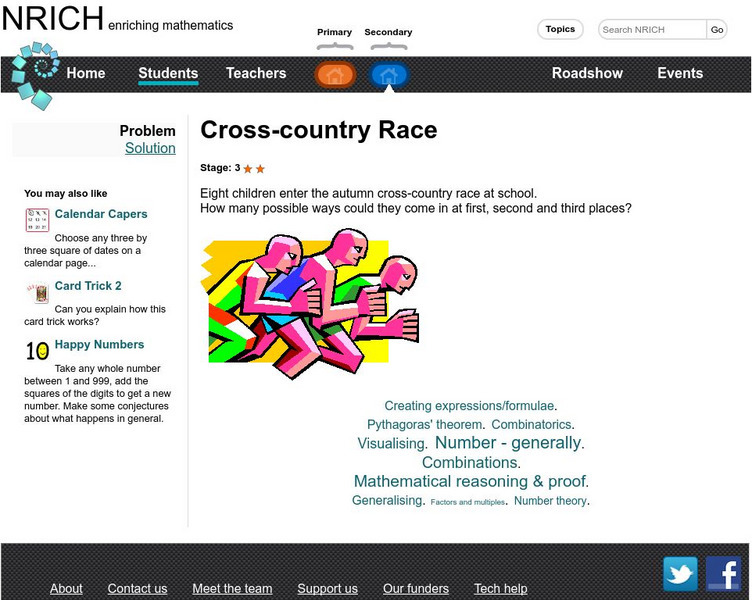
University of Cambridge: Nrich: Cross Country Race
On this one page website sharpen your logic and problem solving skills while working on this challenge. The solution is available to double check your solution.
PBS
Pbs: Mathline Creature Feature Lesson Plan [Pdf]
An interdisciplinary math, science, and language arts lesson that engages learners in an exploration of statistics. Through a study of various forest climates, students utilize data collection and analysis, classification, and graphing....
PBS
Pbs Learning Media: Peg + Cat Collection
The Peg + Cat on-air series and online resources provide many opportunities for educators to introduce or reinforce early math concepts. In each 11-minute on-air episode of this animated, math-based series for 3-8 year olds, Peg and Cat...
Math Is Fun
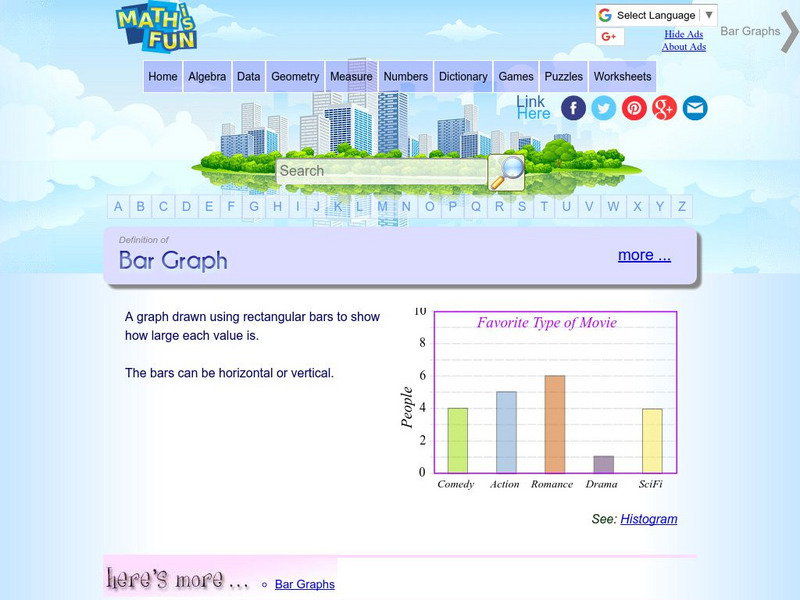
Math Is Fun: Definition of Bar Graph
Get the definition for a bar graph. Then, select the link "here's more" and use the interactive graph to display data as a bar graph, line graph or pie chart. The finished graph may be printed.
Alabama Learning Exchange
Alex: Ice Cream Sundae Survey
Students quickly realize the importance of learning how to read and find information in charts, graphs, and tables compared to finding the same information written in a paragraph. This is a fun, high energy instructional activity!This...
Teachnology
Teachnology: Survey Teaching Theme
Survey Theme provides an excellent collection of free sample worksheets, teacher resources, lesson plans and interactive media for grades k-12.


