Wolfram Research
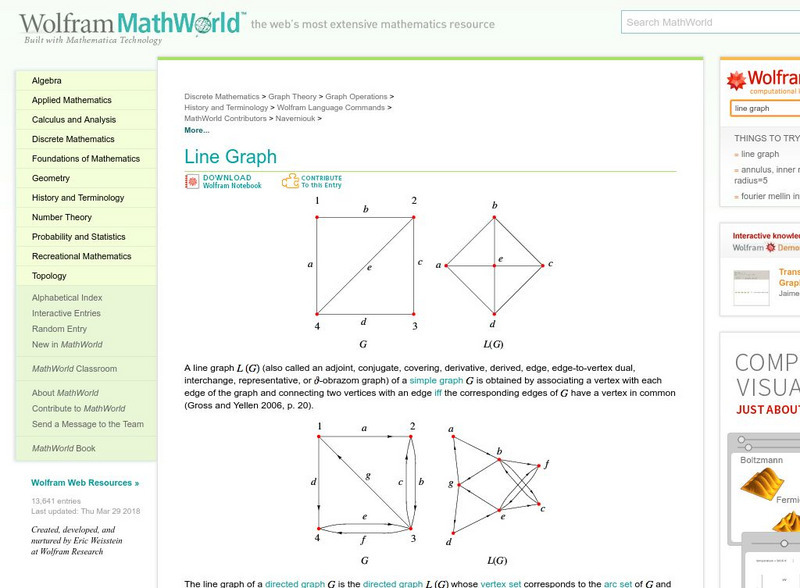
Wolfram Math World: Line Graph
Definition of a line graph with a variety of examples. Includes maps, charts, and detailed explanations for understanding.
University of Cambridge
University of Cambridge: Maths and Sports: Match the Matches
Decide which charts and graphs represent the number of goals two football teams scored in fifteen matches. This data handling activity is designed to get children talking meaningfully about mathematics, presenting and justifying...
McGraw Hill
Glencoe: Self Check Quizzes 2 Circle Graphs
Use Glencoe's Math Course 2 randomly generated self-checking quiz to test your knowledge of circle graphs. Each question has a "Hint" link to help. Choose the correct answer for each problem. At the bottom of the page click the "Check...
Other
Delta State University: Lesson Plan 3: Pie Graphs
The students will gather, organize, and display data in an appropriate pie (circle) graph using M&M's! [PDF]
McGraw Hill
Glencoe: Self Check Quizzes 1 Circle Graphs
Use Glencoe's randomly generated self-checking quiz to test your knowledge of circle graphs. Each question has a "Hint" link to help. Choose the correct answer for each problem. At the bottom of the page click the "Check It" button and...
Wolfram Research
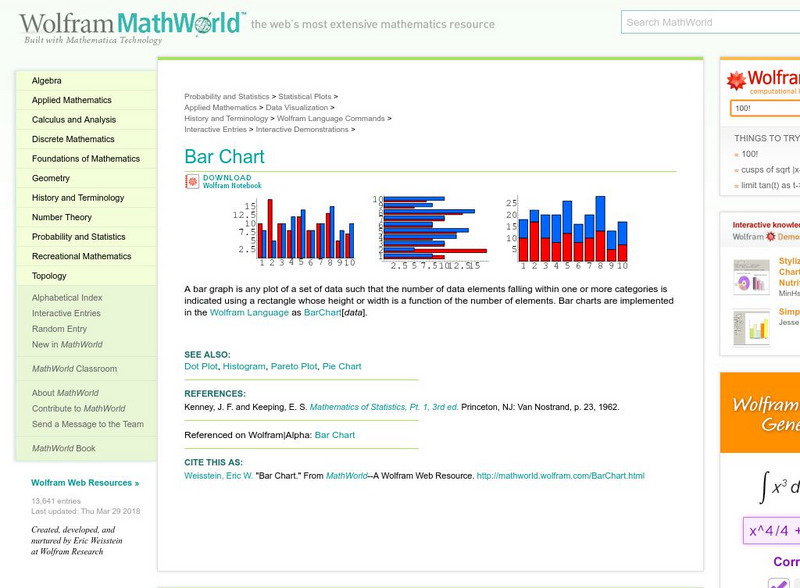
Wolfram Math World: Bar Chart
MathWorld offers a definition and example of the math term, "bar chart."
Purple Math
Purplemath: Graphing Linear Equations: T Charts
A nice tutorial on how to graph linear equations. Goes through the process step by step and gives numerous examples.
The Math League
The Math League: Using Data and Statistics: Pie Charts
This introductory tutorial about statistical graphing with four examples of how pie charts (circle graphs) are constructed and read.
University of Cambridge
University of Cambridge: Maths and Sports: Charting Success
Sports statisticians, trainers and competitors create graphs, charts and diagrams to help them to analyse performance, inform training programmes or improve motivation. This activity encourages students to consider and analyse...
Other
Nearpod: Graphing Equations Using a Table
In this lesson on graphing equations using a table, young scholars will learn how to create a table for a function in terms of domain and range and then graph the function on the coordinate plane.
ClassFlow
Class Flow: Interpreting Tables and Graphs
[Free Registration/Login Required] Explore a variety of graphs and tables. Many activities are incorporated to provide practice solving problems using different graphs and charts.
Math Planet
Math Planet: Pre Algebra: Circle Graphs
Learn about circle graphs or pie charts through examples and a video lesson.
Oswego City School District
Regents Exam Prep Center: Practice With Organizing and Interpreting Data
Several problems are presented to test your skills in creating and interpreting frequency tables, pie charts, box-and-whisker and stem-and-leaf plots.
Wolfram Research
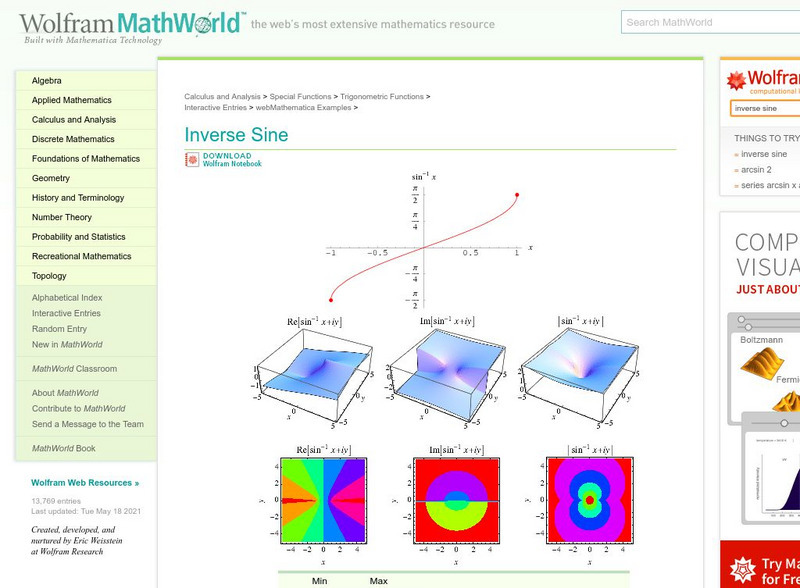
Wolfram Math World: Inverse Sine
This is a math site on the inverse of sine. Includes charts, color graphs, formulas including the Maclaurin series, as well as links to math terms and subject areas used within the site.
United Nations
Unesco: Math Games (In Arabic)
This site offers games and lessons that teach basic math concepts such as area and volume, number patterns, time, etc. Games use familiar tasks such as shopping to reinforce math concepts. While the title of each page includes an English...
Lumen Learning
Lumen: Critical Reading: Specialized Reading Strategies
This instructional activity focuses on specialized reading strategies such as online reading, reading in math, science, etc., and reading charts and graphs. It provides text, videos, charts and graphs, graphics, and a self-check.
E-learning for Kids
E Learning for Kids: Math: Tea Store: Reading a Table
Students will demonstrate how to interpret information in a table.
Primary Resources
Primary Resources: Line Graphs and Pie Charts
Here are a few resources to use with your students when teaching about line graphs or pie charts.
University of Regina (Canada)
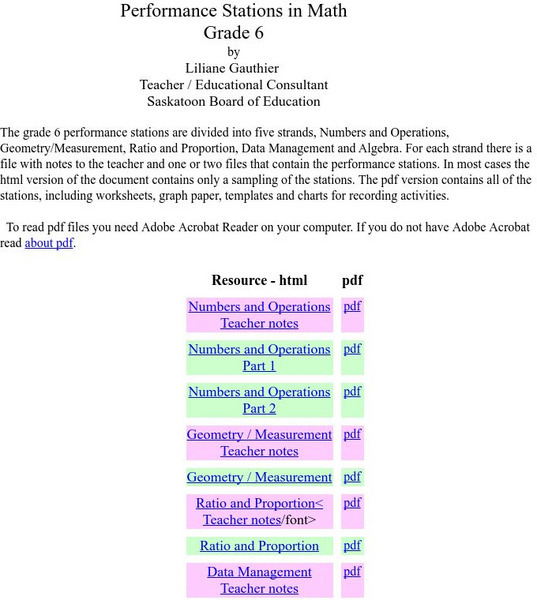
University of Regina: Math Central: Performance Stations in Math: Grade 6
The Saskatoon Board of Education provides teachers with this collection of grade six math performance stations. Although several of the stations have been designed as assessment tools for the Saskatchewan curriculum, teachers may also...
University of Regina (Canada)
University of Regina: Math Central: Performance Stations in Math: Grade 7
The Saskatoon Board of Education provides teachers with this collection of grade seven math performance stations. Although several of the stations have been designed as assessment tools for the Saskatchewan curriculum, teachers may also...
University of Regina (Canada)
University of Regina: Math Central: Performance Stations in Math: Grade 8
The Saskatoon Board of Education provides teachers with this collection of grade eight math performance stations. Although several of the stations have been designed as assessment tools for the Saskatchewan curriculum, teachers may also...
University of Regina (Canada)
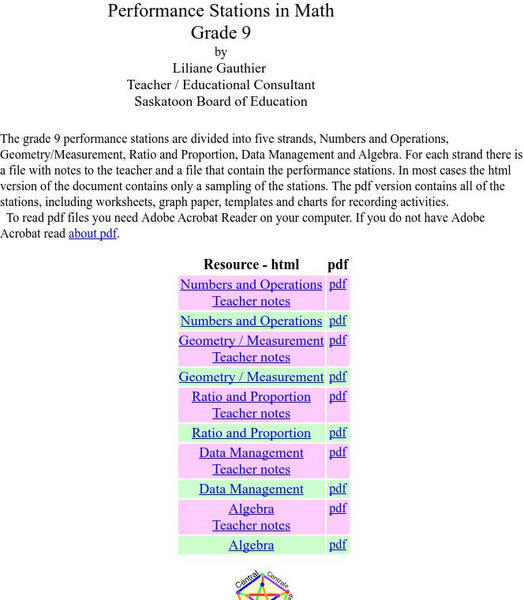
University of Regina: Math Central: Performance Stations in Math: Grade 9
The Saskatoon Board of Education provides teachers with this collection of grade nine math performance stations. Although several of the stations have been designed as assessment tools for the Saskatchewan curriculum, teachers may also...
Scholastic
Scholastic: Max's Math Adventures: A Hairy Situation
Help Max make a bar graph to show the hair colors of his classmates. Teachers will appreciate the activities with bar graphs in the extra challenges. Use the teacher's guide to create a fun and engaging lesson.
Khan Academy
Khan Academy: Read Histograms
Practice reading and interpreting histograms. Students receive immediate feedback and have the opportunity to try questions repeatedly, watch a video or receive hints.
