CK-12 Foundation
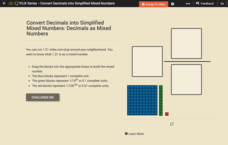
Decimals as Mixed Numbers
Five questions—multiple-choice, true or false, and a discussion—make up an interactive that focuses on decimals as mixed numbers. Moveable blocks assist scholars in finding solutions.
CK-12 Foundation
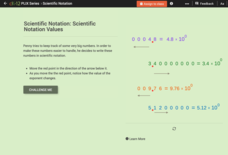
Scientific Notation Values
Scientific notation is the focus of a five-question interactive. A model with movable points offers a visual reference to help solve true or false, multiple-choice, and fill in the blank questions. A discussion question challenges...
CK-12 Foundation
Decimals as Mixed Numbers
A five-question interactive boosts scholars' knowledge of decimals and mixed numbers. Moveable base 10 blocks assist mathematicians in answering a series of multiple-choice and true or false questions. A discussion concludes the practice.
CK-12 Foundation
Fractions as Percents: Baking Cookies
A five-question interactive challenges mathematicians to solve word problems involving fractions as percents. Baking two different types of cookies and needing the exact amount requires scholars to make fractions, turn them into...
CK-12 Foundation
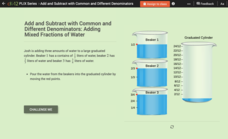
Expression Evaluation with Different Denominators: Adding Mixed Fractions of Water
An interactive challenges mathematicians to add mixed fractions with unlike denominators. Five questions—fill-in-the-blank and multiple-choice—build from one to the next leading the way to an open discussion about denominators and...
CK-12 Foundation
Values Written as Powers: Binary Numbers 1 to 8
A six-question interactive tasks scholars with adding binary numbers one through eight. A tool acts as a visual aid to showcase the patterns made when working with base—2, digits zero and one. Question types include fill in the blank,...
CK-12 Foundation
Values Written as Powers: Binary Numbers 9 to 16
Challenge mathematicians to crack the binary code with an interactive that focuses on numbers nine to 16. A table reveals exponential equations to aid in answering multiple-choice questions. A discussion question gauges comprehension.
Curated OER
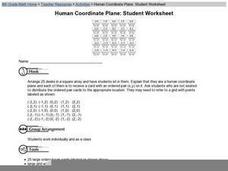
Human Coordinate Plane: Student Worksheet
An excellent way to teach the basics of coordinate graphing is here for you! Young mathematicians take on the identity of one of the two numbers in a coordinate pair, and the entire class must arrange themselves in the proper order. This...
Curated OER
Lesson Design Protocol: Add and Subtract
Addition and subtraction are studied in this math instructional activity. Upper graders add and subtract whole numbers up to 1,000 with and without regrouping.
Curated OER
Reading Tables
Who is two years younger than Meg? Who is older than Paul, but not Kinta? Scholars practice reading tables as they answer comprehension questions based on three sets of data. First, they examine a table depicting ages, then favorite...
EngageNY
Properties of Area
What properties does area possess? Solidify the area properties that pupils learned in previous years. Groups investigate the five properties using four problems, which then provide the basis for a class discussion.
EngageNY
Proving Trigonometric Identities
Young mathematicians first learn the basics of proving trigonometric identities. They then practice this skill on several examples.
Shodor Education Foundation
Triangle Area
While the lesson focuses on right triangles, this activity offers a great way to practice the area of all triangles through an interactive webpage. The activity begins with the class taking a square paper and cutting in in half; can they...
Beacon Learning Center
Line Plots
Introduce line plots, show examples of tables, graphing on a number line, and engage in a class discussion. Share the process by which statistical data is organized and displayed on a number line. Examples and worksheets are included....
Utah Education Network (UEN)
Subtracting Integers
Review the concepts of additive inverses and adding positive and negative integers. Relate understanding to the subtraction of integers. This is done with either the use of "Algeblocks" (any square or tile manipulative should do) or a...
Curated OER
Addition and Subtraction Facts to 20
Fact families, and the relationship between addition and subtraction are the foucs of this lesson. Learners explore strategies to help with their addition and subtraction facts. They use doubles, related facts, and fact families to help...
Curated OER
Loan Amortization - Mortgage
Upper graders explore the connection between interest and principal. They use an amortization schedule to determine the amount of principal paid vs interest on a $100,000 home loan. Fourteen discussion questions and a research-based...
Curated OER
Fractions
What fraction is represented by these shapes? Scholars examine fraction models as they apply basic fraction skills. The first two problems are guided; they look at a set of shapes with some shaded, circling (from three options) the...
Curated OER
Bar Graphs and Pictographs
How are bar graphs and pictographs different? As you begin this concept, use these simple graphs to help get learners started with data analysis styles. There is one bar graph and one pictograph, each accompanied by four or five...
Illustrative Mathematics
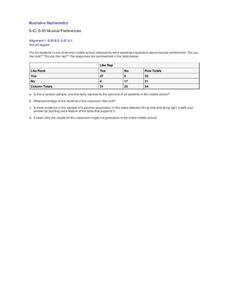
Musical Preferences
If you like rap music, are you more likely to like rock music? Use statistical analysis to determine if there is a positive association between rap and rock in this particular sample. While the problem is relatively simple, the...
02 x 02 Worksheets
Measuring Length
Your young forensic scientists add to and strengthen their measurement and conversion skills with these seven well-scaffold worksheets. Metric conversions, measuring length, area, and volume, reading thermometers, graduated cylinders,...
Illustrative Mathematics
How Many Cells Are in the Human Body?
Investigating the large numbers of science is the task in a simple but deep activity. Given a one-sentence problem set-up and some basic assumptions, the class sets off on an open-ended investigation that really gives some context to all...
Willow Tree
Line Plots
You can't see patterns in a jumble of numbers ... so organize them! Learners take a set of data and use a line plot to organize the numbers. From the line plot, they find minimum, maximum, mean, and make other conclusions about the data.
Curated OER
Pythagorean Theorem by Graphic Manipulation
There are many different ways to show a proof of the Pythagorean Theorem. Here is a nice hands-on paper cutting activity that shows a graphic representation. You can even challenge your young Pythagoreans to come up with their own...
Other popular searches
- Basic Math Skills
- Basic Math Skills Pretest
- Basic Math Skills Test
- Basic Math Skills Inventory
- Basic Math Skills Review
- Basic Math Skills Activities
- Cumulative Basic Math Skills
- "Basic Math Skills
- Prue Test Basic Math Skills
- Pre Test Basic Math Skills
- Basic Math Skills Pretest"
- Basic Skills Math Games


