Curated OER
Perimeters, Patterns, and Conjectures
Students discover patterns and write conjectures relating to perimeters and polygons. Working in cooperative learning groups, they use manipulatives and graphic organizers to solve problems then answer a series of questions in which they...
Curated OER
A thousand seconds
Students use seconds, minutes, and hours. They then discuss the size of a thousand. After that they read time in digital or analogue form.
Curated OER
Parking Meters
Third graders are introduced to the problem with a short discussion about parking. They then solve with a partner. As they work ask questions that focus on the strategies they are using to make the calculations.
Curated OER
Adam's Watch
Third graders use their watches to tell the time while the teacher lists their responses on the board along with the reasons for them (set incorrectly, gain/lose time). They solve the problem in pairs and focus their thinking on the...
Curated OER
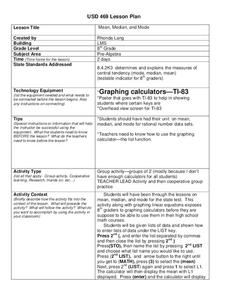
Mean, Median, and Mode
Eighth graders practice using the LIST key on graphing calculators using the proper syntax. They work with the functions of mean, median, and mode in a teacher led lesson and then with a partner on a second data set. They follow...
Curated OER
Cartesian Coordinate System
Learners research the Cartesian Coordinate System and its many uses in the world of mathematics and algebra.
Curated OER
Introduction to Scatter Plots and Correlation
Students examine the concept of scatter plots. They compare baseball statistics to locate the ones that correlate with winning, and identify the positive, negative, and no correlation in sets of data using MS Excel.
Curated OER
Students Analyze Data With Scatter Plots
Scatter plot lessons can help students create different types of graphs by hand or with the aid of technology.


