Curated OER
Do You Have Number Sense?
Seventh graders are grouped according to their ability level with a captain who is elected by the students in that particular group. Students demonstrate their knowledge of rational and irrational numbers by defining them. Students use a...
Curated OER
Geo Jammin'
Students compare and contrast related two- and three-dimensional shapes, and complete a Venn diagram illustrating the attributes of each. Using a poem pattern from another lesson, students use data from the diagram to write an attribute...
Diablo Valley College
The Language of Sets and Set Notation
The basics of number theory and set notation are explained in a highly approachable way in a self-contained lesson and worksheet. Introducing the vocabulary and concepts from ground zero and building to more complex ideas of subsets...
Curated OER
Bodacious Buttons
First graders participate in games, graphing, and probability exercises to sort and graph buttons. They sort buttons with Venn diagrams and Bull's Eye graphs.
Curated OER
Inequalities Compound Fram
Students practice graphing compound inequalities. They draw a Venn Diagram on two different sports visualizing that their is a middle section on commonality among the two sports groups and then relate that concept to compound inequalities.
Pennsylvania Department of Education
Alike and Different
Learners compare and contrast objects and are introduced to a Venn Diagram. In this alike and different lesson, students make observations regarding properties of objects. Learners classify object and build ideas about variables....
Baylor College
Plant or Animal?
Teach your class about the necessities of life using the book Tillena Lou's Day in the Sun. After a teacher-read-aloud, students make puppets depicting different plants and animals from the story and illustrating the habitat in...
Curated OER
What is Soil?
Third graders examine what makes soil by creating a Venn Diagram. In this Earth environment activity, 3rd graders identify the different components that soil is made from. Students bring soil from their homes to examine and create...
Curated OER
The Role of Fire in Healthy Prairie, Brush and Forest Lands
Sixth graders read and discuss background information and brainstorm reasons for wildfires. They use a Venn Diagram to list the similarities and differences between wildfires and prescribed fires and then track the weather forecast for...
Curated OER
Thinking About Money
Students evaluate various approaches to spending money.In this spending money literacy lesson, students broaden their financial goals by reading "Alexander Who Used to Be Rich Last Sunday" and "A Chair for My Mother."Students use a Venn...
Curated OER
The Gummywolf
Learners read a story about "Gummywolf," stopping periodically to answer questions about the progression of the story. Next, they create a Venn Diagram to compare and contrast "Gummywolf" to "Goldilocks and the Three Bears." Students...
Curated OER
George and Sam Save for a Present
Third graders develop their algebraic thinking by recognizing a variety of patterns using concrete objects, numbers, tables, and pictures. In this George and Sam Save for a present lesson, 3rd graders communicate their mathematical...
Curated OER
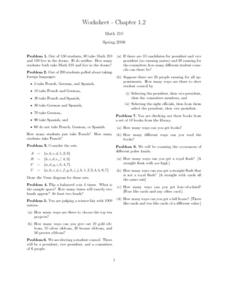
Worksheet - Chapter 1, 2 Combinations
In this combination worksheet, students draw Venn Diagrams, they determine the number of combinations of a particular event using tree diagrams or the fundamental counting principle. This one-page worksheet contains approximately eight...
Curated OER
The Energy that Keeps Us Moving
Young scholars measure the calorie content of food. In this technology lesson, students explore where the CEENBoTs get the energy to make it move. They create a Venn diagram showing the differences of energy in food and CEENBoTs.
Curated OER
OTC Medications
Students sort medications by likeness and use. They compare and contrast using a Venn Diagram, and find the differences and commonalities of over the counter and Rx medications.
Curated OER
Television: Comedy Vs. Drama
Learners investigate the world of Television by contrasting specific programs. In this visual storytelling lesson, students compare and contrast the differences between comedy and drama by making a Venn Diagram. Learners...
Curated OER
Analyzing Graphs and Data
Students collect and analyze data. In this statistics lesson, students graph their data and make inferences from the collected data. They display their data using graphs, bar graphs, circles graphs and Venn diagrams.
Curated OER
Halloween Candy Sort
Learners use their Halloween candy to practice sorting and classifying. They compete a Venn diagram comparing their candy wrappers. They develop ways as a class to catorgize the candy in different ways.
Curated OER
Risk Taker - Probability Web Quest
Students complete an on line, teacher created, webquest to study the origin of probability, theoretical and simulated probability; computing the probability of two independent events; and mutually exclusive events. They make a Venn...
Curated OER
Expanded, Standard and Written Forms
Students explore expanded, standard, and written forms of numbers. In this number sense lesson, students examine the various ways of writing numbers as they complete a Venn diagram activity.
Curated OER
Strawberry Girl: Outdoors in Florida
Students explore nature by researching the state of Florida. In this animal identification lesson, students read a children' story and research the Internet to discover the difference in animal life between the early 1900's and present...
Curated OER
Geometric Solids
Fourth graders examine the properties of geometric solids. Given geometric figures, they brainstorm observations. In groups, 4th graders identify solids and discuss the physical properties. Each student creates a Venn diagram and...
University of Colorado
Are All Asteroids' Surfaces the Same Age?
Did you know scientists can tell the age of an asteroid by looking closely at its craters? This final instructional activity of a six-part series focuses on two asteroids, Gaspra and Ida, in order to demonstrate the concept of dating...
Curated OER
Touch and Discover
Students identify the physical properties of items using the sense of touch. In this touch and discover lesson, students describe items. Students sort items using a Venn diagram.
Other popular searches
- Venn Diagram Math
- Venn Diagram Math Worksheets
- Venn Diagrams Math
- Venn Diagrams in Math
- Graphing Math Venn Diagrams
- Sorting Math Venn Diagrams
- Venn Diagrams & Math
- Math Venn Diagrams Shape
- Venn Diagrams Math Fractions
- Sets Venn Diagrams Math
- Venn Diagram Math Drawing
- Math Venn Diagram Ms


