Hi, what do you want to do?
Wolfram Research
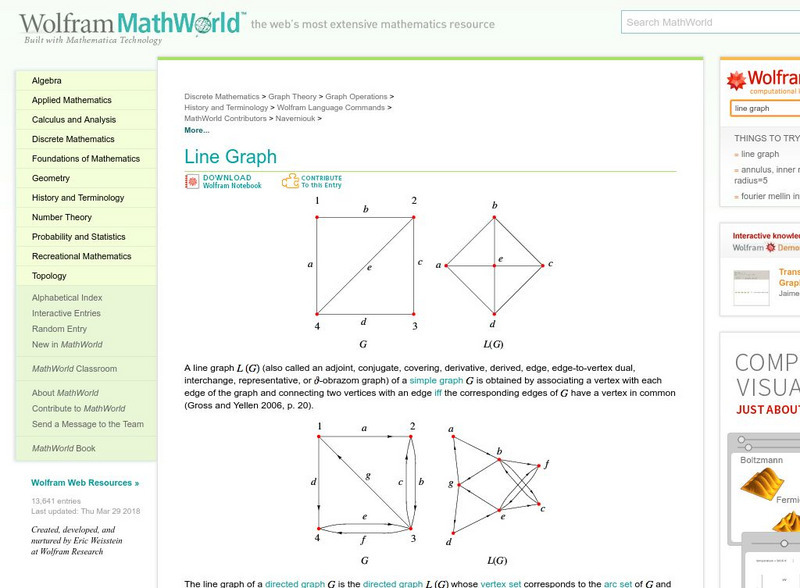
Wolfram Math World: Line Graph
Definition of a line graph with a variety of examples. Includes maps, charts, and detailed explanations for understanding.
Texas Education Agency
Texas Gateway: Evaluate Graphics in Informational/procedural Text
You will learn how to evaluate graphics for their clarity in communicating meaning and achieving a specific purpose.
Other
Bucks County Community College: Visual Organizers
This site walks you through the benefits of visual organizers, and focuses on a variety of types: tables, charts, graphs, timelines, flowcharts, diagrams, and webs.
Sophia Learning
Sophia: Choosing Whether to Use Software or Technology to Enhance Ideas
A tutorial explaining how to use technology to create graphics and visuals to enhance documents and presentations. A brief audiovisual presentation identifies types of visuals, and another audiovisual presentation describes how and when...
US Energy Information Administration
U.s. Eia Energy Kids: Nonrenewable Energy Sources
This resource provides information about nonrenewable energy sources. There is specific information about each of these energy sources, and lots of maps, charts, tables, and graphs to further the understanding.
Texas Education Agency
Texas Gateway: Synthesize Ideas in Informational/expository Text
[Accessible by TX Educators. Free Registration/Login Required] Learn how to synthesize and make logical connections between ideas within a text and across two or three texts representing similar or different genres and to support the...
Other
Hhs: Physical Activity Fundamental to Preventing Disease
Here, read statistics from the US Department of Health and Human Services concerning exercise and its key role in preventing chronic illness and premature death. Use these findings from medical studies in which diseases were studied in...
Other
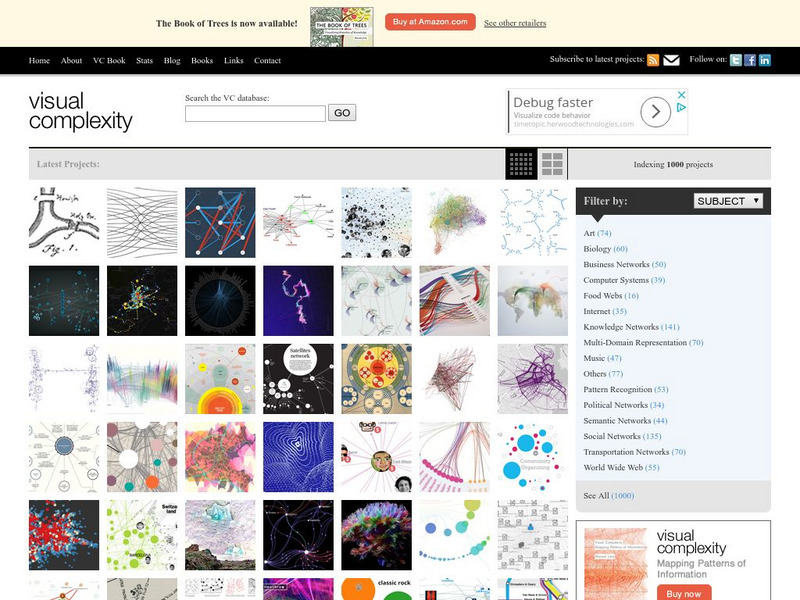
Visual Complexity: Visualizing Complex Networks
Examples of over 300 differnt types of maps, flow charts, and graphs. Emphasis is placed on the artistic and aesthetic qualities of the maps' visual components.
NOAA
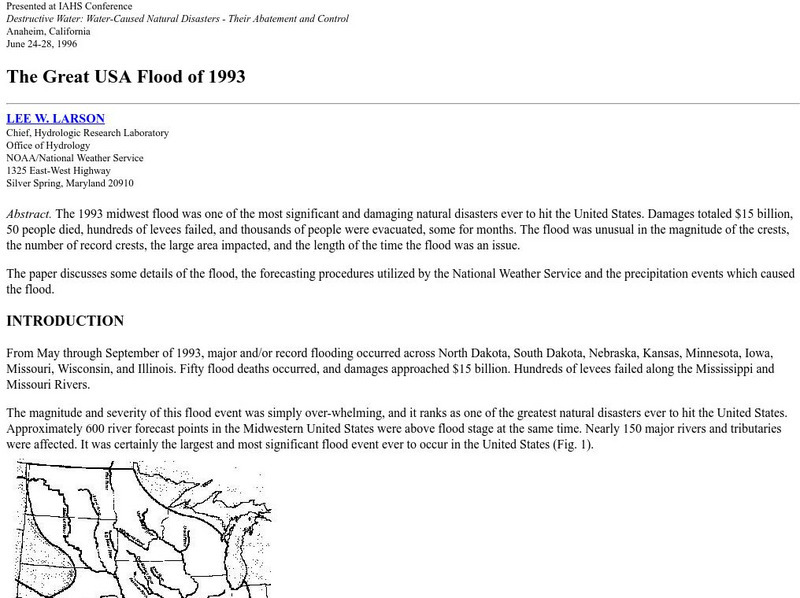
Noaa: The Great Usa Flood of 1993
Interesting abstract about the flood that hit the Midwest in 1993, one of the worst floods in United States History. Find out why the flood occurred, the damage, maps of the damage, charts, graphs, and statistics.
E-learning for Kids
E Learning for Kids: Math: Tea Store: Reading a Table
Students will demonstrate how to interpret information in a table.
Florida Center for Reading Research
Florida Center for Reading Research: Exp. Text Structure: Text Feature Find
A lesson plan in which students look through a book to find various text features including: a table of contents, sequence and format, charts/graphs/maps, diagrams/graphics/illustrations, print variations, an index, and a glossary....
ReadWriteThink
Read Write Think: A Picture's Worth a Thousand Words: Image to Narrative
This instructional activity, which can be adapted to fit with any picture you choose, works for middle schoolers of all levels.
Other
Graphic Greats: Photo Treatment
This resource presents an article about the use of photos in documents.
University of Texas at Austin
University of Texas: Human Environmental Interactions [Pdf]
Inspired by Hemispheres' 2004 Teachers' Summer Institute, People and Place: Human-Geographic Relations, this curriculum unit was designed to address human adaptation to and modification of the environment. How have humans adjusted to...


