Curated OER
You Are Here
Students map local places and learn to use scale and distance. In this mapping lesson plan, students map their school and a favorite place. Students recreate their maps showing distance and scale sizes. Students locate their...
Teach Engineering
Projections and Coordinates: Turning a 3D Earth into Flatlands
Introduce your class to map projections and coordinates, the basics for the work done in a GIS, with an activity that uses Google Earth to challenge learners to think about the earth's shape.
August House
Go to Sleep, Gecko
Use this multidisciplinary lesson to delve into these subjects: English language arts, math, science, drama, and character education. After reading, discussing, and making interpretations about Go To Sleep, Gecko!: A Balinese...
Curated OER
Create A Map!
Students examine two- and three-dimensional shapes, and discuss map skills and attributes. They plan and create their own school campus maps using pre-cut building site shapes.
Curated OER
The Crash Scene
Fifth graders explore geography by participating in a mapping activity. In this engineering instructional activity, 5th graders identify the differences between latitude and longitude and practice locating precise points on a globe or...
Curated OER
Welcome to My World!
Students use maps to locate information. They read the story, "It Looked Like Spilt Milk", view images of the continents and discuss the various continents. Afterward, they make their own Atlas to record information that they can later...
Curated OER
Where Is Japan? How Far Is That?
First graders use literature and hands-on activities with maps and globes to explain distance and tools used to measure distance. They select tools to measure various objects in the classroom, then apply those concepts to their map...
Curated OER
Spatial Connections
Students use maps, scales, and describe locations in order to learn about spatial sense. In this spatial sense lesson plan, students participate in many activities for this spatial sense unit that should last throughout the year.
Curated OER
Mapping with a Compass: A Simulated Survey
Students use compasses and grids to map the locations of artifacts found in a simulated dig site. In groups, they role-play as future archeologists excavating a school site. Groups begin at their assigned datum and site the artifacts...
Curated OER
Studying Snow and Ice Changes
Learners compare the change in snow and ice over a 10 year period. In this environmental science lesson, students use the live data on the NASA site to study and compare the monthly snow and ice amounts on a map of the entire...
Curated OER
It's All in the Pattern
Here is a fantastic, nine-page, multi-session lesson plan on the Zia Sun Symbol (found on the New Mexico state flag), and the seasons of the Earth. Everything you need to implement the lesson is here, and the many engaging activities are...
Curated OER
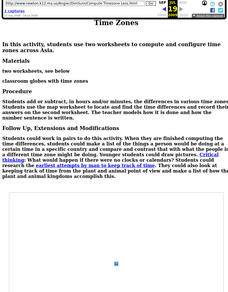
Time Zones
Fifth graders locate different time zones. In this time zones lesson, 5th graders label the different time zones. Students research the different ways man has kept time throughout history. Students also compute the differences in time...
Curated OER
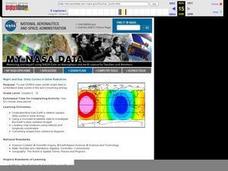
NIGHT AND DAY: DAILY CYCLES IN SOLAR RADIATION
Students examine how Earth's rotation causes daily cycles in solar energy using a microset of satellite data to investigate the Earth's daily radiation budget and locating map locations using latitude and longitude coordinates.
Curated OER
Where in the World is Tacky the Penguin?
First graders complete activities related to they story they are reading in class. Through art and measurement activities, 1st graders relate a story from the "Tacky the Penguin Series" to everyday objects and ideas they encounter.
Curated OER
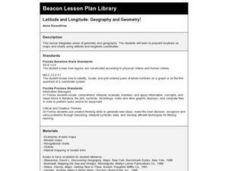
Latitude and Longitude: Geography and Geometry!
Second graders use latitude and longitude coordinates to pinpoint an exact location on the map. For this geography lesson, 2nd graders utilize handouts from the Maritime Museum in order to gain practice in finding locations throughout...
Curated OER
Exploration of Scale Models
Students consider the concept of scale models. In this scale lesson, students compare the sizes of various every day toys to the sizes of the larger objects they represent.
Curated OER
Honing in on Hummingbirds
Students explore ruby-throated hummingbirds. In this cross-curricular hummingbirds lesson, students listen to the book The Mystery of the Missing Hummingbirds and choose related topics to research with a partner. Students draw or...
Curated OER
Travel Time
Students use a migration map to estimate the distance traveled by a bird while migrating south. After calculating accurate estimates of the distance traveled, students compare the distances traveled with the amount of time elapsed.
Curated OER
Trouble in the Troposphere
Students Use data sets from MY NASA DATA to produce graphs comparing monthly and yearly ozone averages of several U.S. cities. They analyze and evaluate the data and predict trends based on the data. In addition, they discuss and...
Curated OER
Geography: Snow Cover on the Continents
Students create maps of snow cover for each continent by conducting Internet research. After estimating the percentage of continental snow cover, they present their findings in letters, brochures or Powerpoint presentations.
Curated OER
Loggerhead Nest Management Program
Students identify the sea turtle management documentary and complete an activity for each slide. They plot the location of nests laid on the island they patrol and discuss their rationale for management decisions. Finally, students...
Curated OER
Minnesota-China Connections:What Time Is It?
Learners calculate the time difference between Beijing, China and their local community. They discuss how time difference affects intercultural communication.
Curated OER
Graphing Ordered Pairs On A Coordinate Plane
Sinking ships, construction paper, coordinate planes, sounds like fun day in math class. Play the game Battleship with your class and reinforce the concept of graphing ordered pairs.
Curated OER
Decisions, Decisions, Decisions
Students examine graphs to find the most appropriate for various kinds of data. In this graphing lesson, student create bar, line and circle graphs. Students create graphs electronically and manually interpreting the data.
